EUR/USD Failed at the 100 Daily SMA and Heads for 1.10 Again Now
EUR/USD turned bullish after the new tariffs announcement, but the 100 SMA provided solid resistance and reversed this pair lower

[[EUR/USD]] turned pretty bullish at the start of this month. This pair has been bearish for a long time and it broke below the long term support at 1.11 at the end of July when the FED didn’t leave the door open for further monetary easing, but Donald Trump’s tweets about new tariffs on China hurt the sentiment surrounding the USD and sent this pair surging higher.
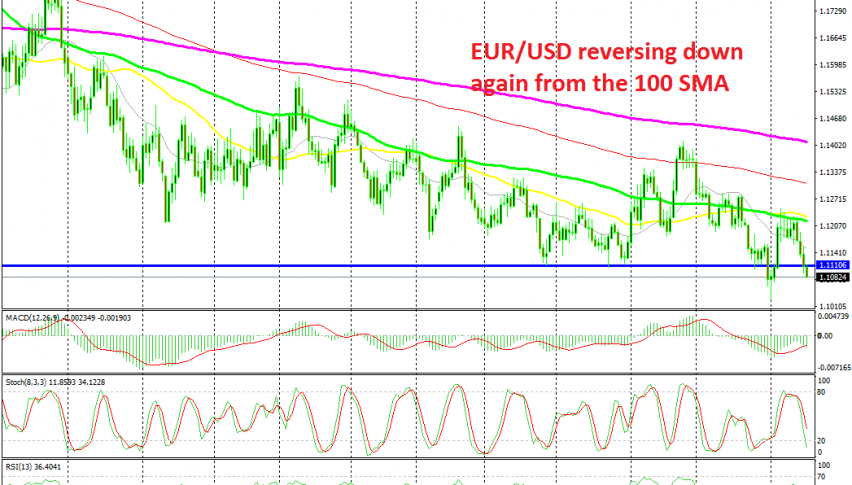
But, moving averages stopped the climb at 1.1250. Moving averages have been pushing this pair lower and this month the 100 SMA (green), helped by the 50 SMA (yellow) provided solid resistance for this pair, stopping the bullish momentum at the beginning of August.
The price formed a nice reversing chart setup on the daily time-frame. The stochastic indicator became overbought, which meant that the retrace was complete, a number of reversing candlesticks such as dojis and pins formed below the moving averages and the 50 and 100 SMAs were also providing resistance. The price reversed lower and now it seems like we will head for 1.10 again. This time, this round support level might have to go which would open the door for further losses for this pair.
- Check out our free forex signals
- Follow the top economic events on FX Leaders economic calendar
- Trade better, discover more Forex Trading Strategies
- Open a FREE Trading Account


