Crude Oil Faces Two Indicators as it Climbs Higher


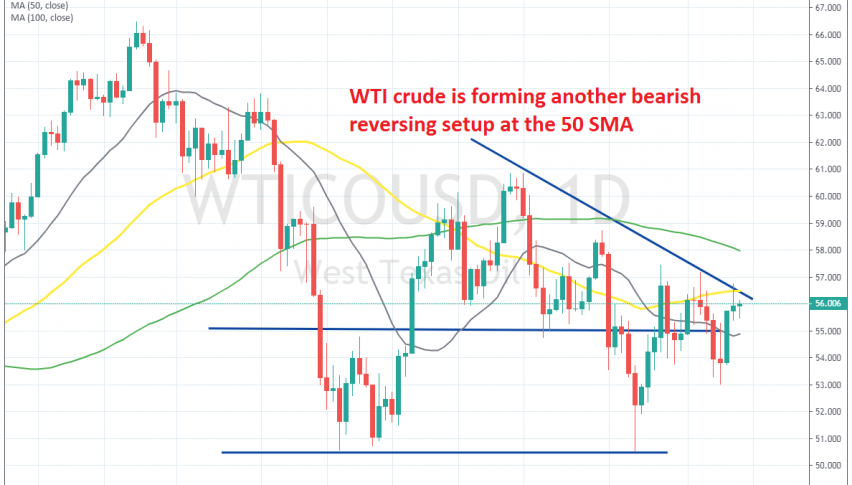
Crude Oil has been on a bearish trend since April, although a base has been put in place for US WTI crude at $50, which is a strong support level. Last week was pretty bearish for Crude Oil, but this week the price has reversed and we saw WTI Oil climb from $53 on Monday after forming a doji candlestick, which is a reversing signal, to $56.70s yesterday.
But, the climb ended right at the descending trend line which connects recent highs. That’s a good sign for sellers. Besides that, the 50 SMA (yellow) was also hanging around there on the daily time-frame chart, so it added extra strength to the trend line as resistance.
The improvement in the sentiment in financial markets helped Oil after some softer tones from Donald Trump on China in the last few days. But, the trade war continues and the global economy keeps weakening, so the softer comments won’t help Oil for too long.
Yesterday’s candlestick closed as an upside-down hammer which is a reversing signal, so we might go short on Oil soon. Although, I would like to see another try to the upside. If that fails, then that would be the final signal to go short.