The cryptocurrency market slowed down! Let’s look at the charts to find out where Bitcoin and some major altcoins are heading next.
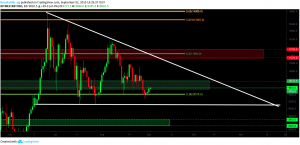
BTC/USD DAILY CHART

Bitcoin bounced off nicely the 0.382 fib level at $9,500 and is currently in support zone up to $10,120. Bitcoin will most likely range between the current support and the resistance at $11,500; however, the overall trend is currently in a descending triangle, which is rather bearish. Bitcoin finds its next major support between $8,200-$8,500 and between $7,400 and $7,800.
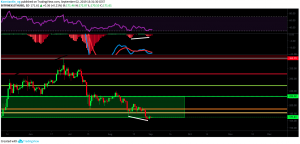
ETH/USD DAILY CHART

Ethereum is at the lower end of the support zone between $171 and $230, and slightly below the golden ratio at around $180. The RSI is nearing oversold regions and the MACD’s histogram is showing a bullish divergence. Chances are that Ethereum might be soon on its way towards the $200 mark. In case of a bearish continuation of the trend, Ethereum finds its next major support around $140.
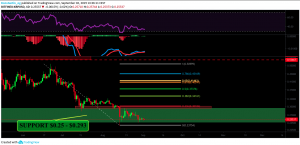
XRP/USD DAILY CHART

XRP is still in support zone and it is nearing the lower end of the support at $0.25. With the RSI gaining strength and the MACD’s histogram climbing higher, it should be only a matter of time until XRP goes for a decent rally towards the 0.236 fib resistance level at the $0.30 mark. If Ripple continues its downturn, it will find its next major support between $0.19 and $0.20.
The biggest gainers of last week were
DEX, which rose by 300 percent,
STC, which gained by 42 percent, and
LOL, which surged by 62 percent.


