EUR/JPY – You Know the Trend is Strong When the 20 SMA Comes Into Play
EUR/JPY has been bearish since early 2018 and the trend is getting stronger as time goes by
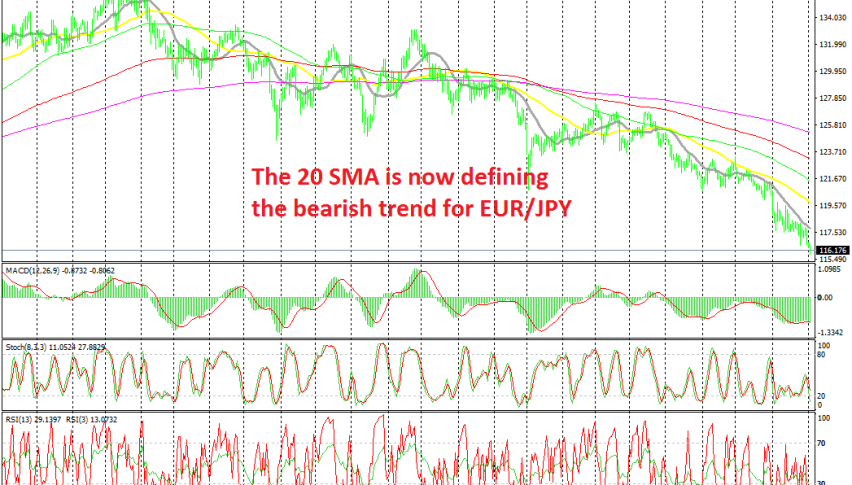
EUR/JPY has been bearish since February last year, as the sentiment in financial markets turned negative with the start of the trade war. The downtrend used to be slow at first, with EUR/JPY making new lows, retracing higher, and then turning down again and making lower lows.
The larger moving averages were providing resistance during pullback higher at first, but as months went by and the trade war escalated, the smaller moving averages took matters into their hands and turned into resistance for this pair on the daily chart.
In February this year, the 100 SMA (green) turned into resistance, then in May and June the 50 SMA (yellow) was pushing the price lower, while in the last month the 20 SMA (grey) decided to come into play and define the trend for EUR/JPY.
In the last few days this pair has made another big bearish move as EUR/USD broke below 1.10, so now the pressure is quite strong on the downside and we have a bearish bias towards it. If I see this pair retrace to the 20 SMA again on the daily chart, I will try to pick an entry point on the H4 chart and go short on EUR/JPY.
- Check out our free forex signals
- Follow the top economic events on FX Leaders economic calendar
- Trade better, discover more Forex Trading Strategies
- Open a FREE Trading Account
Related Articles

Comments
Sidebar rates
Related Posts
