Has the Bullish Move Ended at the 50 SMA for Bitcoin?


BITCOIN turned quite bullish in Q2 of this year after it broke the range between $3,000 and $4,000 where it traded for several months. During that time, Bitcoin climbed more than $10,000, but stalled below $14,000 and since topping out, the highs have been getting lower.
Although, lows haven’t been getting lower. A support level has formed around the $9,000 level which has reversed Bitcoin higher and stopped it from turning bearish. At the end of last week, the price fell to $9,200s but reversed up after forming a doji candlestick on the daily chart.
Bitcoin turned bullish after that candlestick and climbed around $1,500. But, the climb stalled at the 50 SMA (yellow). The stochastic indicator is now overbought so this might as well be the end of the climb. If that’s true, then we have yet another lower high.
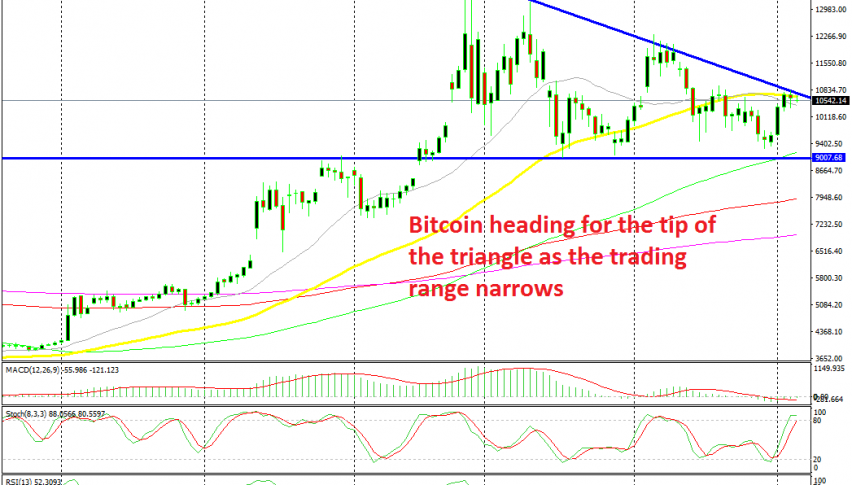
Now a triangle is forming in Bitcoin and we might see the price bounce inside it until it explodes in either direction. This might be a good trading setup, but we are heading for the tip of the triangle now and the range is getting pretty small, while the spread in crytpos is quite large. So, we might wait and trade the break of the triangle when it happens.