Making Use of the 50 SMA as we go Short on USD/CAD


USD/CAD used to be pretty bullish during July, which continued in the first week of August as crude oil turned bearish. The price consolidated during most of August, but it has turned pretty bearish this month. Crude Oil has turned pretty bullish in the last several days, with US WTI crude climbing more than $5 and eyeing $60 as the sentiment in financial markets improves on softer tones from the US and China, which is helping risk assets.
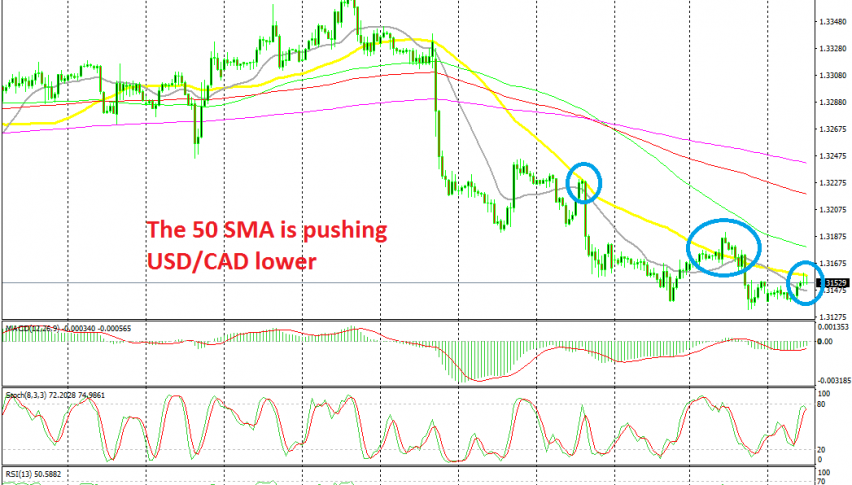
As a result, USD/CAD has turned bearish and the pace is quite strong, considering that the smaller period moving averages are providing resistance on the H1 chart. We can see that the 50 SMA (yellow) provided resistance late last week and again this week.
The buyers pushed the price above the 50 SMA yesterday, but it returned below it, so the 50 SMA continues to act as resistance. In the last two hours we have seen this pair knock on the 50 SMA twice, but the 50 SMA has rejected it. The previous candlestick closed as an upside-down pin, which is a reversing signal after the retrace higher. The retrace is also complete now as the stochastic indicator shows, so we decided to use this opportunity and open a sell forex signal against this moving average. Now, let’s see if the reversal will come.