Repeating Friday’s Trade on USD/CAD
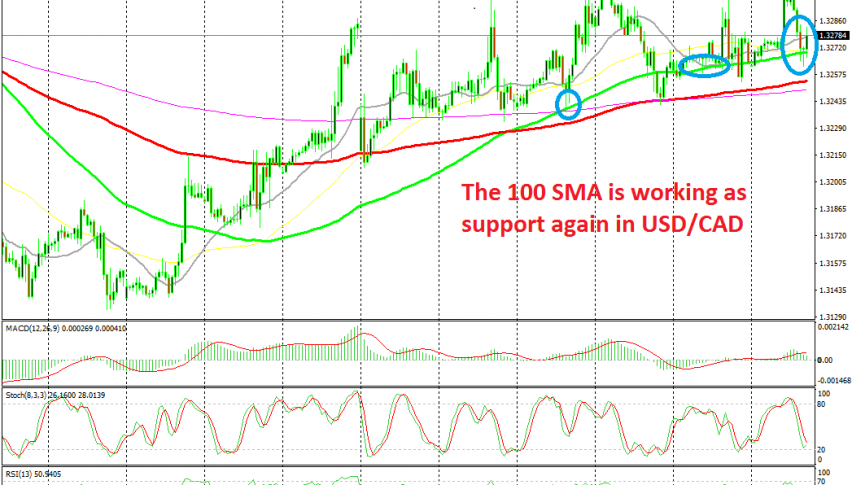
USD/CAD has retraced lower after the jump this morning, but the 100 SMA is holding again as support, like it did on Friday
At the beginning of last week, USD/CAD opened with a bearish gap lower as Oil prices surged more than $10 higher, after the attack on Saudi Arabia Oil facilities which helped the CAD move higher and USD/CAD lower. But, the economic data from Canada last week was negative and this pair resumed the uptrend after that bearish gap. Inflation posted a decline, as did the manufacturing sales and core retail sales.
Besides that, Saudi Arabia said that it can restore the facilities and full production by next week, which has turned crude Oil prices lower. US WTI crude has fallen into the $58 region now after trading close to $64 early last week. As a result,the pressure has been to the upside on this pair.
For that reason, we decided to buy the pullback to the 100 SMA (green) on USD/CAD last Friday. The price fell below that moving average, but it reversed back up again as Oil continued to retreat lower and this morning we saw a surge in this pair, which took the price to our take profit target.
The situation was similar a couple of hours ago. USD/CAD retraced lower after that jump this morning, but the 100 SMA held the decline once again. The stochastic indicator was oversold which means that the retrace lower is complete and the H1 candlestick above the 100 SMA closed as a pin, which is a reversing signal. So, we took that opportunity and went long onthis pair, just like Friday. Now let’s wait, as the reversal is already underway.
- Check out our free forex signals
- Follow the top economic events on FX Leaders economic calendar
- Trade better, discover more Forex Trading Strategies
- Open a FREE Trading Account
- Read our latest reviews on: Avatrade, Exness, HFM and XM
Related Articles


Sidebar rates
Related Posts
