

Commodity Dollars turned pretty bullish in the first week of this month, as the USD turned bearish. NZD/USD climbed around 170 pips higher during that week, but it ran into the 100 SMA on the H4 chart, which provided solid resistance in the second week. This pair traded below the 100 SMA the entire second week of September, without being able to break that moving average.
Then, after failing to push above the 100 SMA for more than a week, buyers finally gave up and last week NZD/USD turned pretty bearish. The sentiment surrounding risk assets such as commodity currencies turned pretty negative last week and this pair gave back all the losses from the previous weeks.
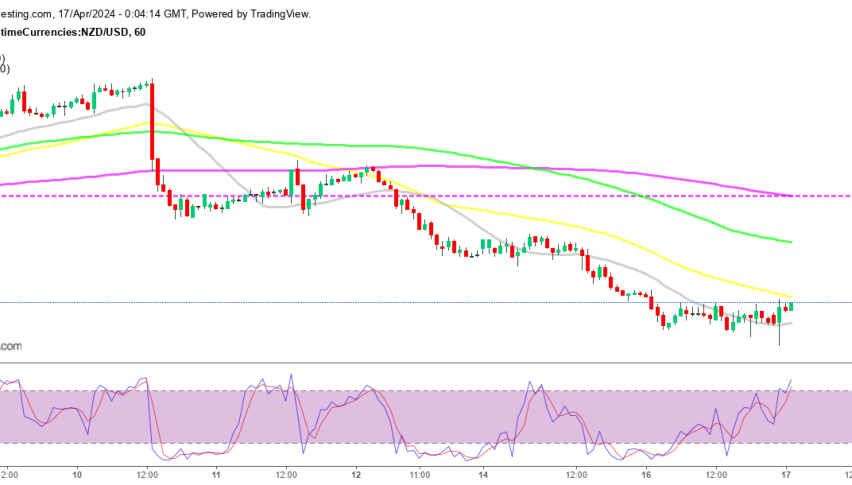
As you can see from the H1 chart above, the downtrend was quite strong last week as shown by the smaller period moving averages, such as the 20 SMA (grey) and the 50 SMA (yellow), which provided solid resistance during retraces higher.
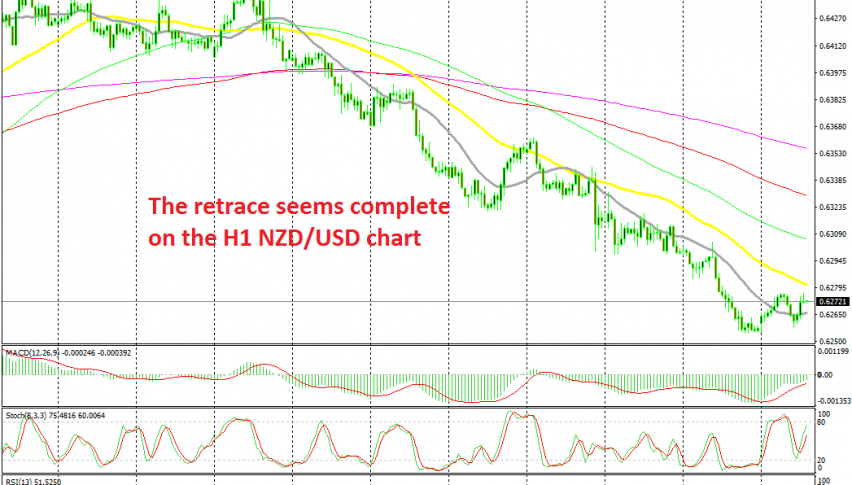
Today, we are seeing another retrace higher and we decided to take this opportunity to go short on NZD/USD. The stochastic indicator is almost overbought which means that the pullback is complete. Besides that, the previous H1 candlestick closed as a doji, which is a reversing signal after the pullback.