USD/CAD Continues to Find Support at the 100 SMA
USD/CAD has been bullish since the middle of September. It made a bullish move back then, then it traded sideways for a couple of weeks and last week we saw another bullish move. USD/CAD was trading sideways since then, but yesterday we saw a bearish reversal, as Crude Oil turned bullish.
Today, we heard that an Iranian Oil vessel was attacked by missiles, which damaged two tankers in it. We still don’t know who carried out the attack, but everything points to Saudi Arabia. Anyway, despite who shot the vessel, Crude Oil has climbed more than $3 from the lows yesterday.
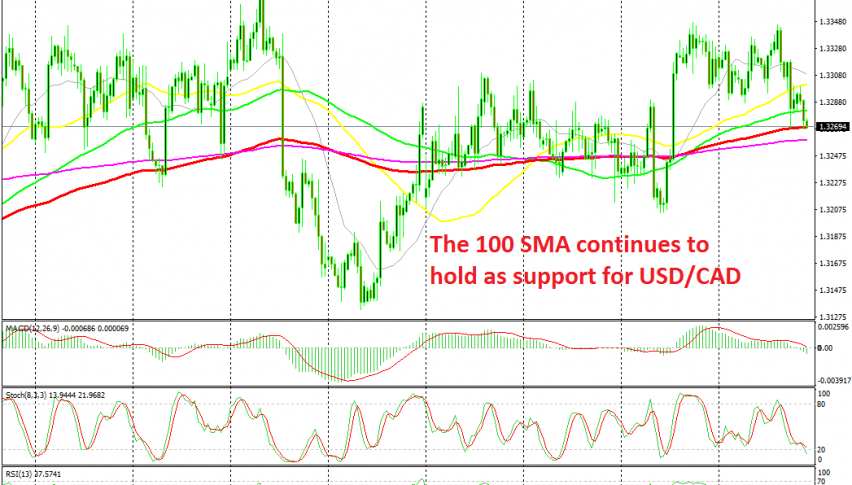
As a result, USD/CAD has turned bearish in the last two days. We decided to take this opportunity and go long on this pair at the 100 SMA (red) on the H1 chart, which comes at the same level as the 50 SMA (yellow) on the H4 time-frame, as shown on the chart above.
But, the decline continued and after the attack, Crude Oil broke the 50 SMA. Although, the decline stopped right at the 100 SMA (red). The price bounced off that moving average, but the bounce stopped at the 50 SMA, which seems to have turned into resistance now.
USD/CAD returned lower, but it has been finding support at the 100 SMA. Now this indicator is the last hope for our trade on this pair. If it goes, then sellers will resume control.


