Could This be a Double Bottom for GBP/USD?
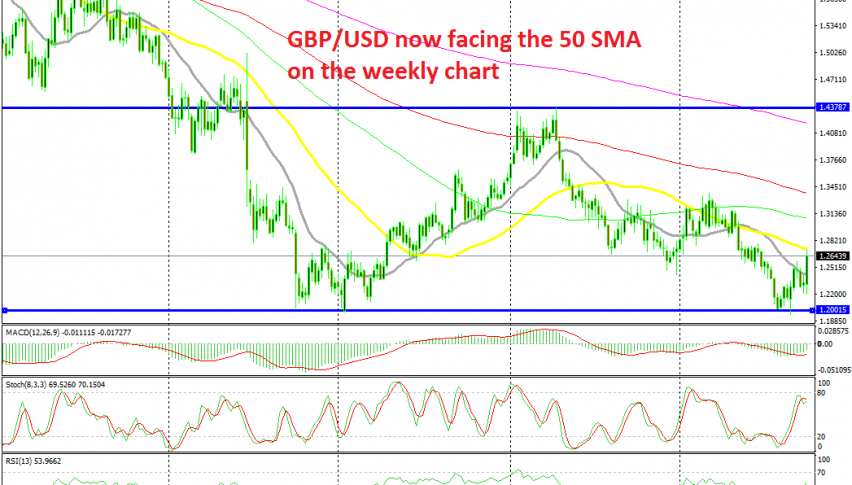
GBP/USD turned really bullish last week, but it faces the 50 SMA on the weekly chart now

[[GBP/USD]] has been on a bearish trend since the middle of 2014. The US economy was improving at a decent pace back then and the FED turned bullish which turned this pair bearish for a couple of years. Then came the Brexit vote and things went downhill pretty fast for the GBP.
This pair fell to 1.20 towards the end of 2016 and it broke that big support level in January of the following year. But it reversed higher and climbed back up in 2017, reaching as high as 1.4375 in April last year. But, buyers ran into the 50 SMA (yellow) on the weekly chart.
So, the 50 SMA is a support/resistance indicator for this pair on the monthly time-frame and the 20 SMA (grey) also does that job, as the chart above shows. GBP/USD turned bearish after that and broke below 1.20 again last month, as Boris Johnson and the EU were failing at striking a Brexit deal.
But, the rumours and comments of recent days from both sides point to a possible Brexit deal coming through this month, ahead of the deadline on October 31. As a result, the price has climbed around 750 pips from the bottom, so there are premises for a double bottom chart pattern to form here, which is the opposite of a double top pattern.
Although, the price has to move above last year’s highs at 1.4370s for this pattern to come into effect. If that happens, the target would be at 1.6870s. But, buyers should take out the 50 SMA (yellow) first, because this pair found resistance at that moving average again on Friday last week.
Although, Brexit is running the show for the GBP now, so if they fail to reach a deal, the support zone below 1.20 will be broken. But if a deal is reached, then we should keep this scenario in mind.
- Check out our free forex signals
- Follow the top economic events on FX Leaders economic calendar
- Trade better, discover more Forex Trading Strategies
- Open a FREE Trading Account


