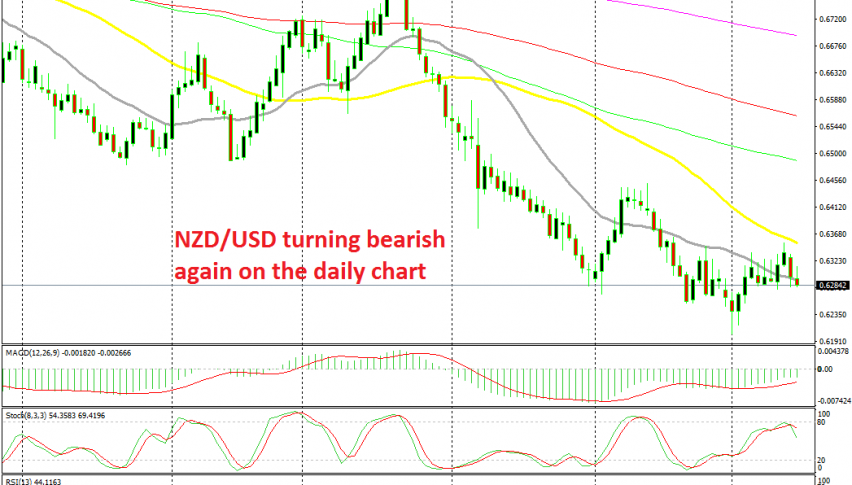
The Daily Chart Shows That the Retrace Higher is Complete for NZD/USD


NZD/USD turned quite bearish in July and August and the bearish momentum continued in September. We saw some new lows for this pair, but only after buyers put up a decent fight in the first week, sending this pair nearly 200 pips higher.
This month we have seen a similar scenario take place. NZD/USD turned bullish in the first week of October, after the soft US ISM manufacturing and non-manufacturing reports. The climb stalled for a few days, but in the last two days the buyers came back again.
The comments that China and the US could reach a partial deal and positive comments regarding Brexit as well turned the sentiment bullish, which benefits the risk assets. NZD/USD climbed for around 150 pips in total, but it ran into the 50 SMA (yellow) on the daily chart.
The retrace was complete by Friday close, as the stochastic indicator shows. The 50 SMA also provided resistance and yesterday the price reversed back down. The comments from China that it needs more time to negotiate hurt the market sentiment a bit, which was another reason for the bearish reversal in this pair.
So, the retrace higher seems complete, but if the US and China finalize the first part of the deal, as they call it Phase One, then we will likely see this pair sure higher, together with AUD/USD. So, it’s not wise to go short right now until we see how the situation evolves between US and China, let things settle for a while, and then we reconsider.