The Retrace Lower Seems Complete for NZD/USD
NZD/USD has been bullish for a week,but it retraced lower today. Although,the retrace seems complete now
[[NZD/USD]] turned bullish on Tuesday last week as the risk sentiment improved in financial markets due to the Brexit deal between the EU and Boris Johnson and the partial trade deal between US and China. Risk assets surged as a result, while safe havens and the USD tumbled lower.
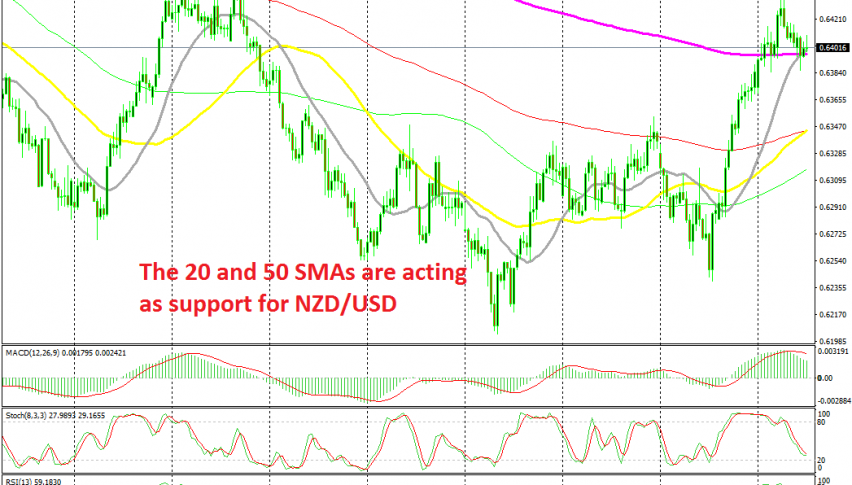
NZD/USD climbed nearly 200 pips in the past week. Although, the climb stopped right below the previous high at 64.40 which seems to have turned into resistance now and this pair retraced lower. The price formed a doji candlestick on the daily chart which is a bullish reversing signal.
The decline has continued today as well, as you can see from the chart above. The price slipped below the 200 SMA (purple) and the 20 SMA (grey) for some time, but it pulled back above them and closed there, so that doesn’t count as a break. Now these two moving averages are providing support on this time-frame and stochastic is almost oversold.
The retrace seems complete now and the trend is still bullish. So, this might be a good opportunity to go long on this pair, since markets are expecting the FED to cut interest rates again this month. Until then, I expect the USD to remain bearish, thus NZD/USD could be bullish.
- Check out our free forex signals
- Follow the top economic events on FX Leaders economic calendar
- Trade better, discover more Forex Trading Strategies
- Open a FREE Trading Account
Related Articles

Comments
Sidebar rates
Related Posts
