Moving Averages Keep Pushing USD/CAD Lower
USD/CAD has been bearish for three weeks now, as Oil climbs higher, and MAs are helping keep it that way
[[USD/CAD]] turned bearish by the second week of this month. The really poor manufacturing figures from the US hurt the USD, which sent it down across the board. USD/CAD made a decent fall that week, but the decline has slowed since then, although the trend is still bearish.
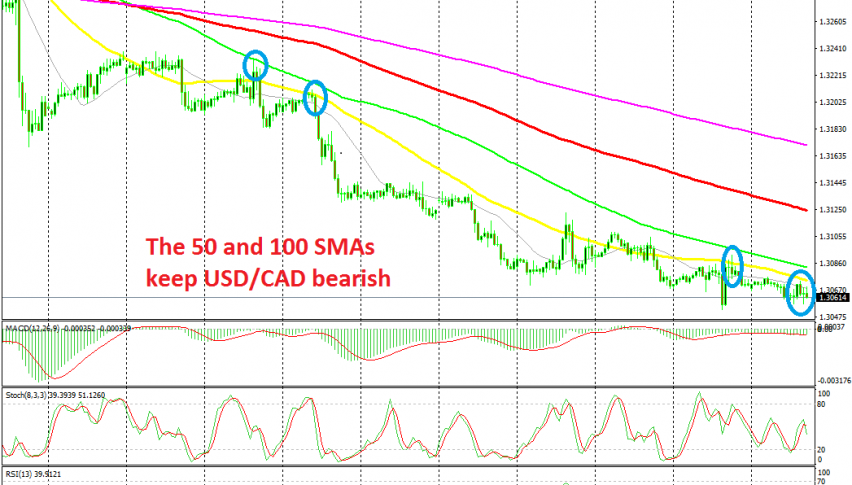
On the H1 chart, that job has been done by the 100 SMA (green) and most notably, by the 50 SMA (yellow). These moving averages have provided resistance many times in these three weeks and in the last few days the price is reversing at the lower MA, the 50 SMA. Yesterday and today the price has reversed at the 50 SMA, helped by the increase in crude Oil prices. So, as long as Oil keep climbing, since OPEC is expected to cut production again soon, is looks luring to sell USD/CAD at the 50 SMA.
The 20 SMA is pushing USD/CAD lower here
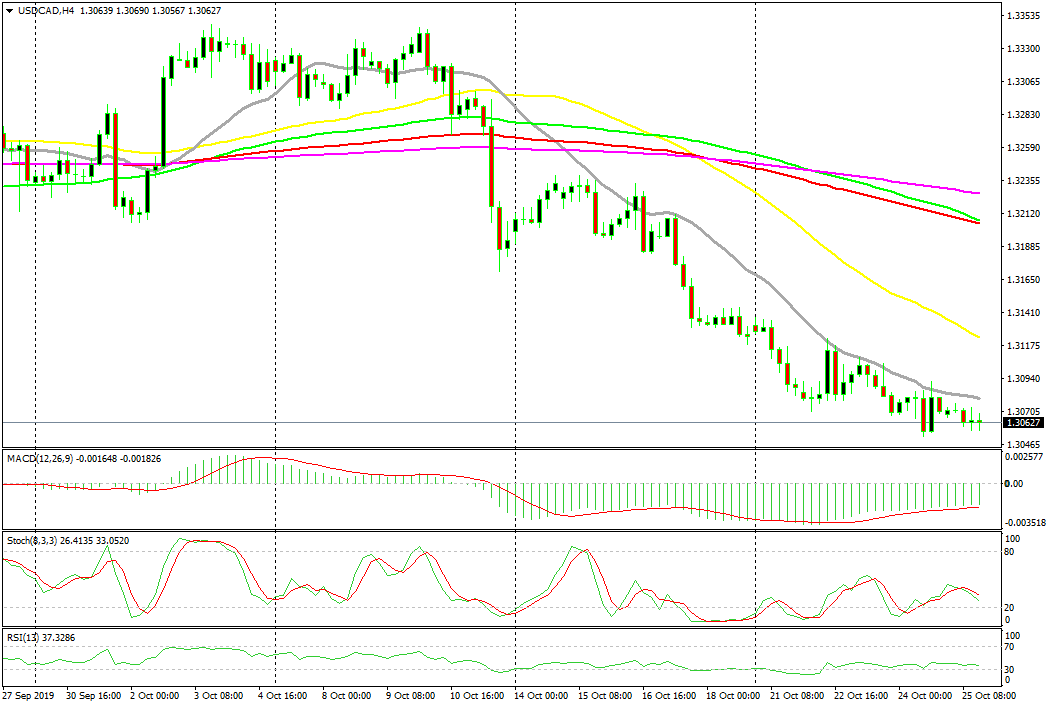
During this time, moving averages have down a good job in providing resistance during pullbacks. They have reversed the price down and pushed this pair lower for three weeks now. On the H4 chart, it has been the 20 SMA (grey) which has provided resistance and pushed the price lower, as you can see from the image above.
- Check out our free forex signals
- Follow the top economic events on FX Leaders economic calendar
- Trade better, discover more Forex Trading Strategies
- Open a FREE Trading Account
Related Articles


Comments
Sidebar rates
Related Posts
