The 50 SMA Will Likely Turn Into Resistance For EUR/USD
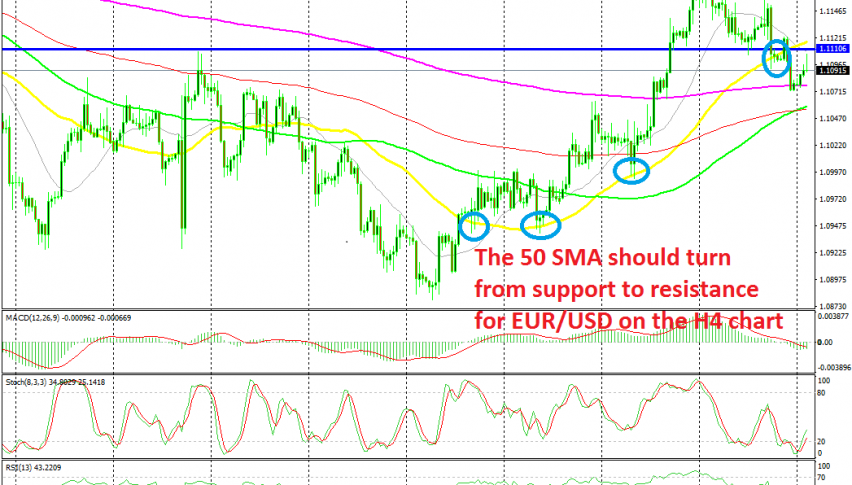
EUR/USD has bounced higher off the 200 SMA on the H4 chart, but the 50 SMA should turn into resistance now
[[EUR/USD]] has turned quite bullish this month, for a number of reasons. Brexit is one of the main reasons, as it seems to be heading towards a solution. The US-China trade war is another reason, while the reversal started due to the soft US ISM manufacturing report at the beginning of the month.
As a result, the pressure has been on the upside for this pair and moving averages have turned into support, especially the 50 SMA (yellow) on the H4 chart. This moving average turned into support immediately after the price moved above it and it has done so four times in total, in the last four weeks.
Although, sellers finally broke this moving average to the downside towards the end of last week, after it bounced slightly higher. The price slipped below it and has traded below the 50 SMA since then, but the 200 SMA (purple) has now turned into support.
The price has bounced off the 200 SMA, but odds are that the 50 SMA now turns from support into resistance. This moving average stands at around 1.1120 now, so when the price gets there, I will look to sell this pair. But, only after I get a reversal confirmation, such as a doji or pin candlestick.
- Check out our free forex signals
- Follow the top economic events on FX Leaders economic calendar
- Trade better, discover more Forex Trading Strategies
- Open a FREE Trading Account
Related Articles

Comments
Sidebar rates
Related Posts
