The Price Action Points to a Bullish Reversal in Ethereum as it Moves Above the 50 SMA


Cryptocurrencies had a terrible year in 2018, losing most of their value. But, after consolidating in Q1, digital currencies turned bullish and ETHEREUM climbed more than $280 from the bottom. At first, it wasn’t certain if Ethereum would turn bullish, but after trading close to the 50 SMA and eventually crawling above it, it became increasingly clear that the trend was changing.
But, the climb ended in all major cryptocurrencies and Ethereum turned bearish, breaking all moving averages on the way down. The 20 SMA (grey) was the first to go on the daily chart, then the 200 SMA (purple) and so on. These moving averages turned from support into resistance as the price moved below them.
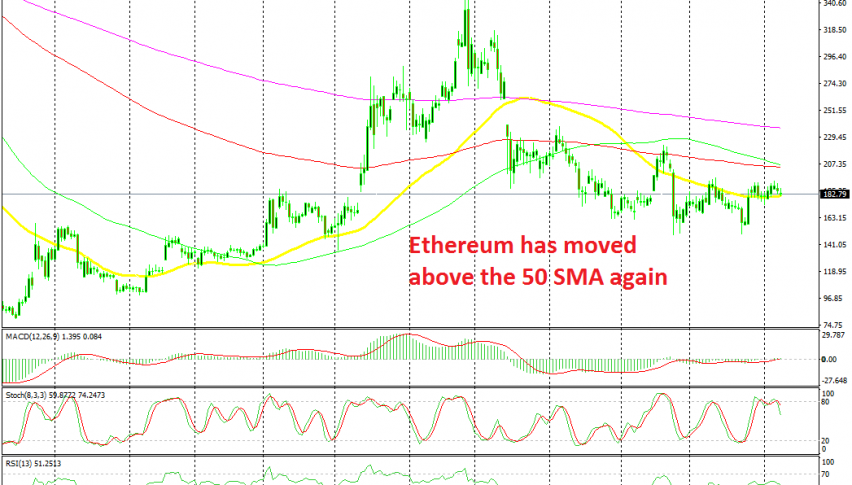
But, the chart setup is looking increasingly like the one we saw before the surge in Q2. Ethereum found resistance at the 50 SMA (yellow) last month and after making a move lower, it climbed back up above it. The price has been trading above the 50 SMA for nearly two weeks now, which is a sign that the downtrend might have ended.
So, we might see a bullish reversal soon on Ethereum, but I will wait until stochastic becomes oversold on this time-frame. Then, if we get a reversing signal such as a doji candlestick, then we might open a long position on this altcoin.