NZD/USD Still Unable to Break the 100 SMA
NZD/USD has been bullish in the last two months, but the 100 daily SMA is proving too strong of a resistance for buyers
[[NZD/USD]] has been trading in a bearish trend since early last year, losing around 14 cents since then. Although, since September we have seen buyers put up a decent fight, pushing this pair higher. The sentiment improved in September after China and the US calmed tones, following a pretty hot summer and risk assets such as the NZD climbed higher.
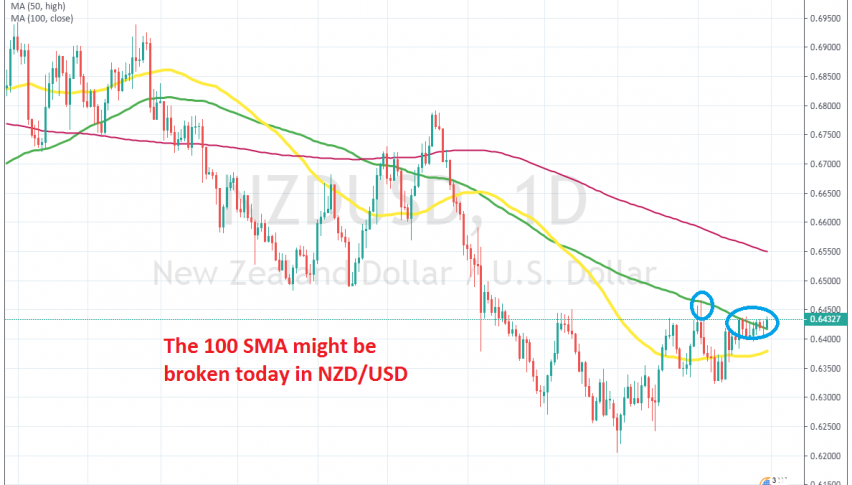
The price eventually moved above the 50 SMA (yellow) on the daily chart and after a retrace lower, buyer pushed higher again, reaching the 100 SMA (green). The price reversed down again earlier this month, suggesting that this moving average would be a tough hurdle to overcome for buyers.
In the second half of this year, buyers returned again and the bullish momentum resumed. But once again, they couldn’t be able to push above the 100 SMA. The 100 SMA has turned into a strong resistance now, and it is pushing the price lower.
This chart setups points to a bearish reversal and odds are high that we might see a dip below the 50 SMA once again. Then, after the US and China sign the Phase One deal, we might see a reversal and a climb above the 100 SMA. But, the main trend will continue to stay bullish, in my opinion.
- Check out our free forex signals
- Follow the top economic events on FX Leaders economic calendar
- Trade better, discover more Forex Trading Strategies
- Open a FREE Trading Account
- Read our latest reviews on: Avatrade, Exness, HFM and XM
Related Articles


Sidebar rates
Related Posts
