The Decline Might Be Ending for Bitcoin
Cryptocurrencies had a great quarter in Q2 of this year, with BITCOIN surging more than $10,000, from around $3,000 to below $14,000. Crytpocurencies are pretty trendy, so the climb in Q2 was straightforward, without much resistance on the way up. Although, the same principle applies when the opposite happens. In Q3, the trend shifted and bitcoin has been pretty bearish since then.
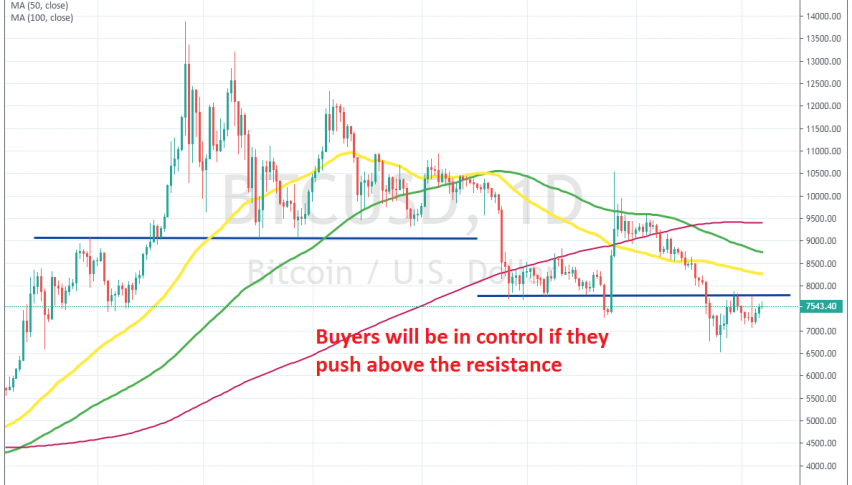
The downtrend hasn’t been so straightforward, with Bitcoin finding support above the $9,000 level at first, which had provided resistance back on May, when Bitcoin was on the way up. That support area resisted throughout the summer, until September, when sellers finally pushed below it.
Then, the area below the $8,000 level turned into support for more than a month, until late October when Bitcoin made a fake-out break below that support zone, only to reverse and surge higher to around $10,500. But, buyers couldn’t keep the price above the 100 SMA (green) on the daily chart, which turned into a resistance indicator for Bitcoin and the downtrend resumed. So, it seems like big cats in the industry were haunting some weak stops, both on the downside when the fake-out happened, and on the upside, when the $3,000 surge took place.
The decline continued until BITCOIN reached $6,500 late last month, where the decline ended, for the time being. Bitcoin retraced higher, but the previous support below $8,000 turned into resistance now, as shown from the main daily chart at the top and the price reversed back down.
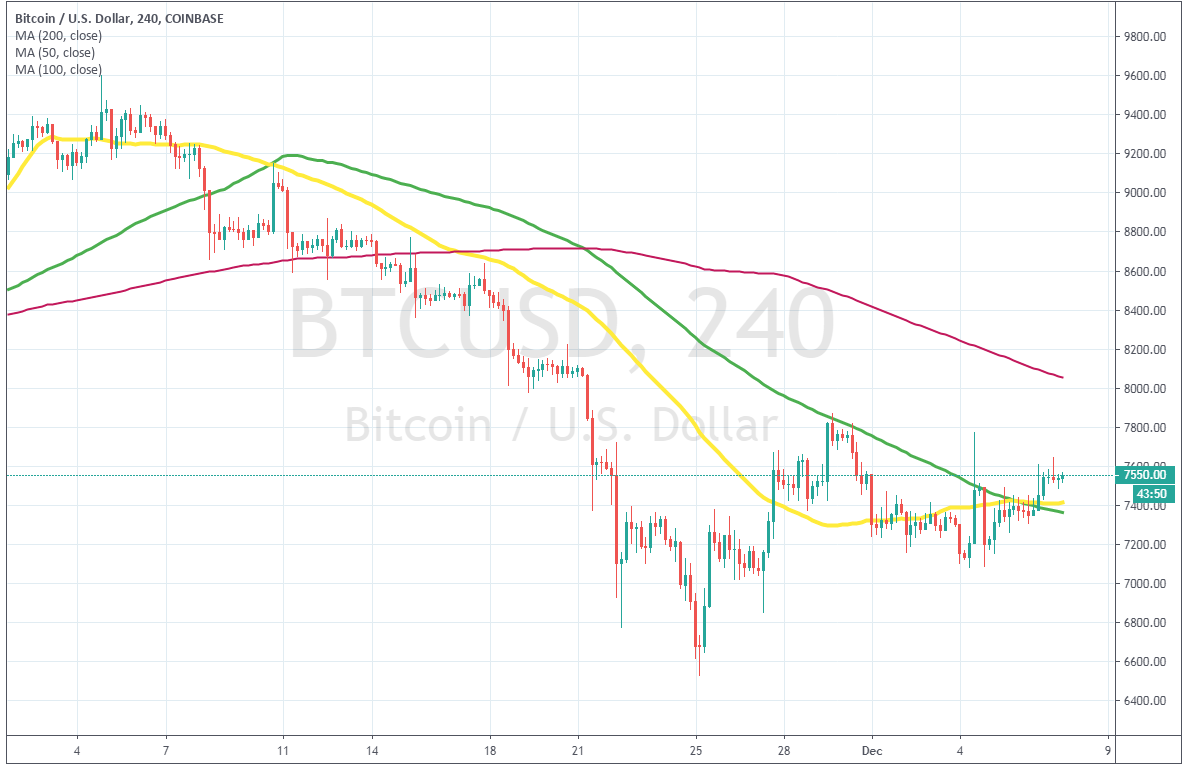
Bitcoin has moved above 2 MAs now on the H4 chart
On the H4 chart, it was the 100 SMA (green) which provided resistance. Bitcoin turned lower again, but the decline this week looked really weak. In fact, buyers took things on their hands towards the end of the week and pushed above the 50 SMA (yellow) and the 100 SMA. This sort of price action tells us that sellers are getting exhausted, while buyers are becoming more active.
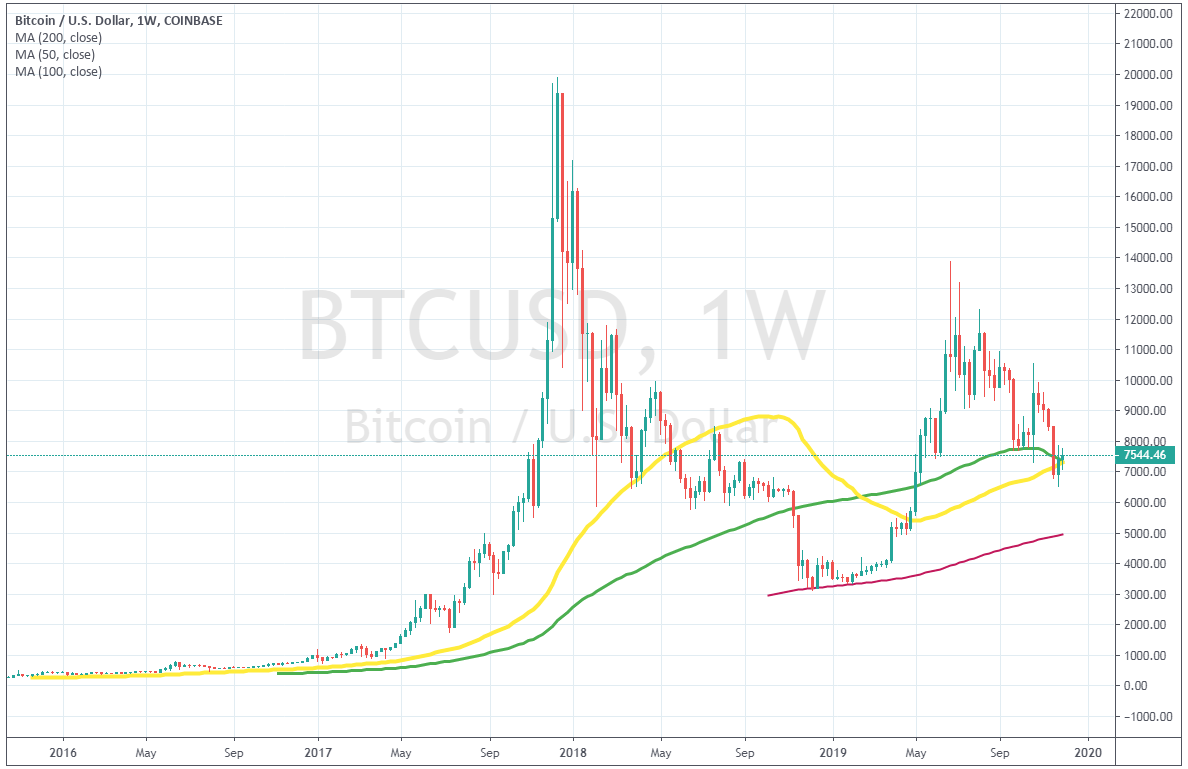
The price is trading above 2 MAs as well on the weekly chart
Looking at the weekly chart, we see that the retrace is now complete, if the decline of the last several months can be considered as such. But, it should, since the lows are getting higher, meaning that the main trend is still bullish. Besides that, the 50 and 100 SMAs are providing support on this time-frame. The price slipped below it in November, but has climbed above them again now, which point to a bullish reversal soon.
besides the technical reasons, Bitcoin has a fundamental reason to turn bullish as well. United States Securities and Exchange Commission approved another Bitcoin derivatives fund. As reported by Cointelegraph, BTC futures-focused NYDIG Bitcoin Strategy Fund is now allowed to offer its shares to institutional investors.
So, more money will be coming in from large institutional investors, which is a positive thing for Bitcoin. So, bullish signals are accumulating for Bitcoin and it will be wise to follow closely in the coming days/weeks to see when the big reversal will take place, since it will offer massive profits if we play it right.
- Check out our free forex signals
- Follow the top economic events on FX Leaders economic calendar
- Trade better, discover more Forex Trading Strategies
- Open a FREE Trading Account