Is This it For the Uptrend in EUR/USD?
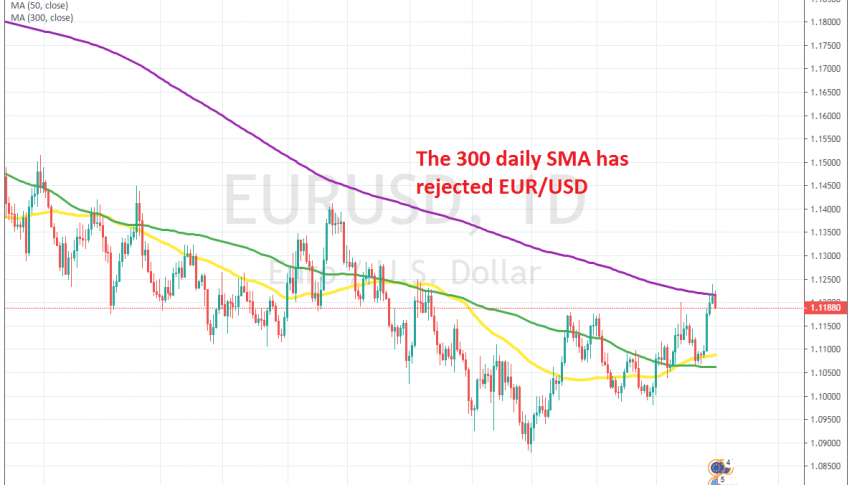
EUR/USD has retraced higher in the last three months, but the retrace seems complete and the 300 SMA has capped the upside move
[[EUR/USD]] has been bearish for quite a long time on larger time-frame charts. In September, this pair made some new lows, breaking below 1.09, after the the European Central Bank cut deposit rates to -0.50%, from -0.40% and announced the restart of the QE programme.
But, the situation improved in October, after the terrible US manufacturing report that month. Sellers pushed lower again in November, but in December the situation improved again for this pair. US manufacturing ISM missed expectations again, falling into contraction, while the sentiment in financial markets improved due to the Phase One deal agreement between US and China.
The last week of last year was pretty bad for the Buck due to year-end cash flows, which sent this pair around 100 pips higher, after having found support at the 100 SMA (green) on the daily chart. But, the 300 SMA (purple) seems to have turned into resistance now.
That moving average rejected the price on Tuesday, despite being pierced for a short time and today’s candlestick looks pretty bearish. This pair is well overbought now and the main trend is stil bearish, so this might be the case for sellers to look for long term sell signals. After all, the European economy remain in a terrible shape, as manufacturing reports showed earlier this morning.
I would like to go short here as well, but will wait for another retest of the 300 SMA. If that happens and buyers fail to push above it, then that would be a great sign to go short. So, follow us for a long term trade on this pair, which we will open when the time is right.
- Check out our free forex signals
- Follow the top economic events on FX Leaders economic calendar
- Trade better, discover more Forex Trading Strategies
- Open a FREE Trading Account
- Read our latest reviews on: Avatrade, Exness, HFM and XM
Related Articles


Sidebar rates
Related Posts
