Gold Trading Between MAs as Traders Try to Decide


GOLD remained bullish throughout the year in 2019 and it closed the year with a bang, as year-end cash flows went against the Buck and into safe havens, just to be safe, in case of another world war breaking out. They weren’t wrong on that, since tensions between US and Iran in the first week of this year could have taken us to another world war.
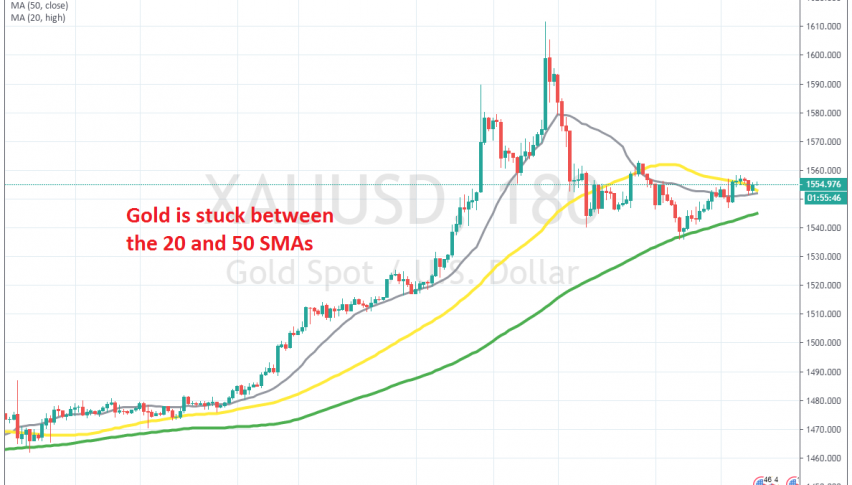
So, safe havens started the year on a strong bullish foot, with Gold gaining nearly $100. But, tensions abated and the sentiment improved. Gold retreated down as a result and slipped below the 20 SMA (grey) and the 50 SMA (yellow), but it found support at the 100 SMA (green), as shown in the chart above.
US and China signed the Phase One deal yesterday, but markets are being cautious, waiting for any catalyst to give them a direction. So, Gold has been trading sideways, stuck in between the 100 SMA at the bottom and the 50 SMA at the top. The sideways price action is expected to continue until MAs meet each other, in which case, Gold buyers will be forced to make a move in either direction. We can trade the range until the break takes place.