Large Moves in NZD/USD, but the 100 SMA Remains as Resistance
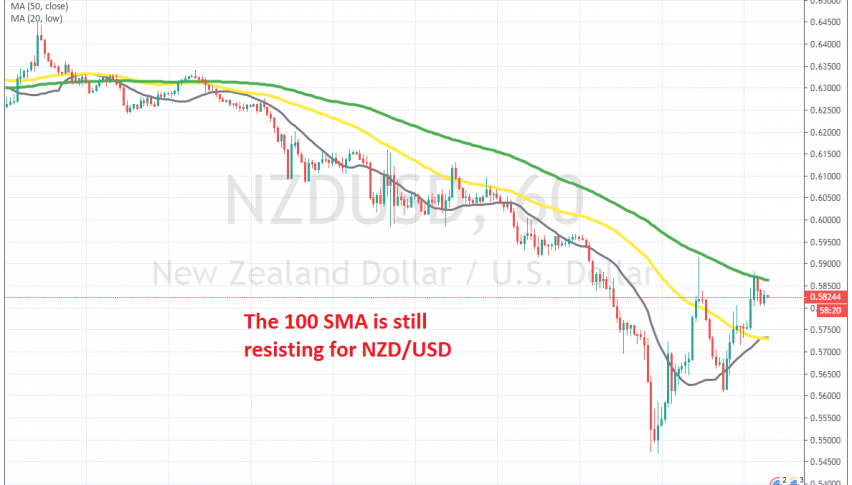
The last two weeks have been pretty horrible for risk assets, with commodities and commodity dollars plunging nearly 10 cents lower. NZD/USD fell from around 0.64 earlier this month, to 0.54 yesterday. Although, we finally saw a decent pullback yesterday in Commodity Dollars.
NZD/USD retraced around 450 pips higher for no reason; I suppose it was just time for a decent retrace after the massive decline. During the decline the smaller moving averages such as the 20 SMA (grey) and the 50 SMA (yellow) have been providing resistance, thus pushing the price lower on the H1 chart.
This shows the strength of the bearish trend in this pair. But, as the price retraced higher yesterday, both those moving averages were broken. Although, the 100 SMA (green) took their place and provided solid resistance. The price reversed down and declined around 300 pips.
But overnight another retrace has taken place, but the 100 SMA is still resisting. I am looking to open a sell forex signal at the 100 SMA now, but we already have a long term sell trade in AUD/USD. So, I will follow the price action for some time to see if sellers are about to get started again.


