

Like everything else, AUD/USD has also gone through a roller-coaster in the last month or so. It was trading at around $66.50s earlier this month, but crashed down to $55 in a couple of weeks, which means a decline larger than 10 cents. I am glad we caught some of that decline, making around 300 pips selling this pair this month.
The 20 SMA (grey) has been providing resistance above, on the daily chart earlier this year, but in March the decliene was too strong. So, AUD/USD fell to $55 as traders turned into the USD in this turbulent times, which is the world reserve currency.
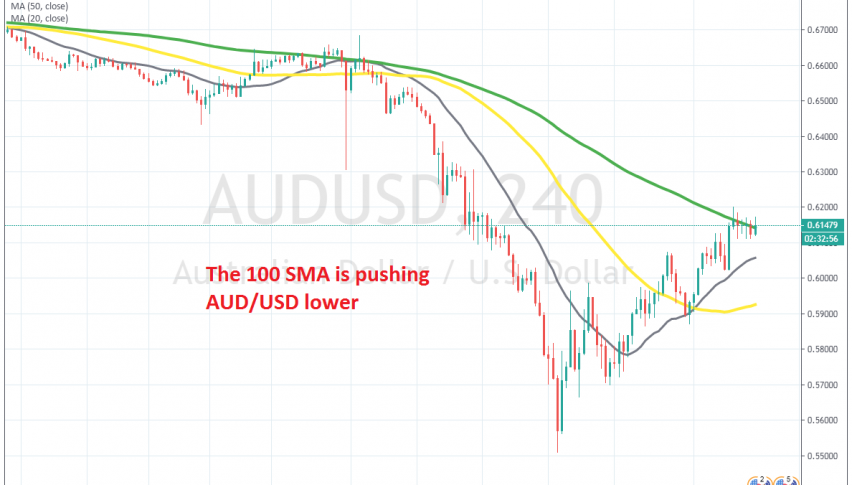
But last week, the USD retreated and suffered some major losses. As a result, this pair retraced around 7 cents higher, from $55 to $62. Although, it seems like buyers are having trouble pushing above the 100 SMA now on this time-frame.
They have pierced above it several times, but no candlestick has closed above it. So, the 100 SMA providing resistance, while the 20 SMA has turned into support. A battle is taking place around the 20 SMA now, so let’s see who will win. If buyers manage to push above it, then the 100 SMA will likely turn into support and will be a good place to buy, since the 20 SMA is also approaching it fast.