USD/CAD Bounces Off the 100 SMA But Faces the 50 SMA Now
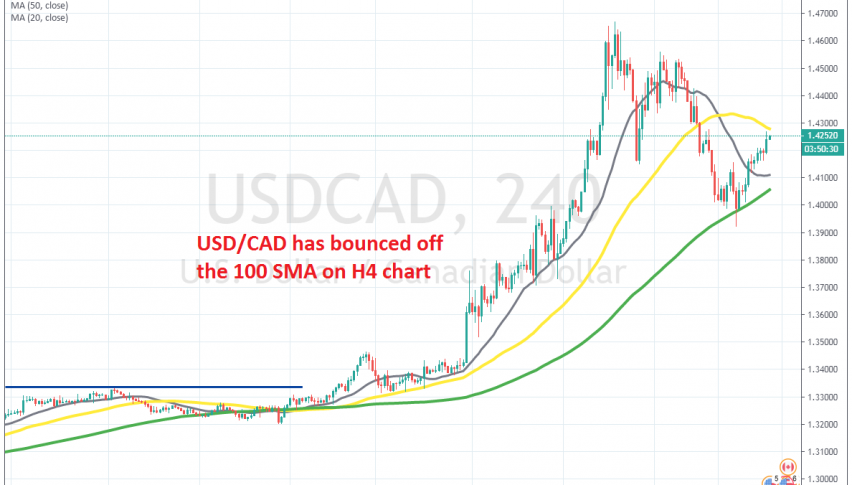
USD/CAD retreated lower to the 100 SMA on the H4 chart last week, but it has bounced off of it this week
[[USD/CAD]] surged higher this month for a couple of reasons. The USD turned massively bullish in the first two weeks of March, as traders turned to it as a world reserve currency in times of coronavirus, while Crude Oil crashed down as Saudi Arabia decided to flood the market with cheap Oil, in order to kill opposition, such as Russia and US shale producers.
The CAD is closely correlated to Crude Oil, so it went down with it, sending USD/CAD higher. This pair gained more than 13 cents, but it retreated lower last week, as the USD also retreated after the US government introduced a $2 trillion bill to help the economy due to coronavirus.
That said, the decline stopped right at the 100 SMA (green) on the H4 chart. This moving average provided solid support and the price bounced off of it earlier. But now, USD/CAD is facing the 50 SMA (yellow) on this time-frame. If the buyers make a clear break of the 50 SMA, then the larger bullish trend is back on. If not, then we might see another pullback lower to the 100 SMA. But, Crude Oil is declining, so I think that the 50 SMA will probably let go now.
- Check out our free forex signals
- Follow the top economic events on FX Leaders economic calendar
- Trade better, discover more Forex Trading Strategies
- Open a FREE Trading Account
Related Articles


Comments
Sidebar rates
Related Posts
