The 100 Daily SMA Seems to Be Turning From Support Into Resistance for USD/CAD
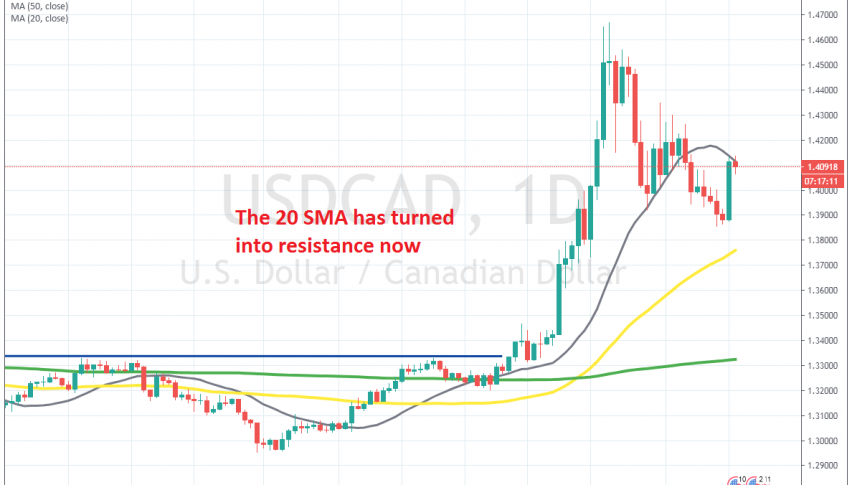
USD/CAD surged nearly 300 pips higher yesterday, but the 20 SMA stopped the climb

[[USD/CAD]] turned really bullish in the first half of March, climbing around 15 cents from the bottom to the top. One of the reasons was the fact that markets turned to the USD as a world reserve currency, out of panic, as the coronavirus pandemic broke out in Europe.
The other reason was the Oil was between Saudi Arabi and Russia which sent crude Oil crashing more than $20 lower, with US WTI falling below $20. Right now, US WTI crude is trading right at $20, after bouncing to $29 last week, as OPEC+ decided to cut production by 9.6 million barrels/day.
So, crude Oil remains bearish and the Canadian Dollar is closely correlated to it, hence the massive move in USD/CAD during that period to the upside. But, the USD retreated lower and USD/CAD declined as well. Although, the decline wasn’t as strong as in other pairs.
This means that the CAD remains weak, and the Oil prices show that. During the retreat though, USD/CAD was finding support at the 20 SMA (grey) on the daily chart, which was pushing it higher. But, the 20 SMA ws broken and the price fell below 1.40. Although, we saw a 250 pip surge yesterday as crude Oil fell lower, but the 20 SMA turned into resistance.
This moving average is holding USD/CAD subdued now and will probably decide the fate of this pair for the coming days. If buyers push above it, then it’s likely that the larger bullish trend will resume, if not, then we will see some omore bearish action, especially if Oil bounces form the $20 level where it is now.
- Check out our free forex signals
- Follow the top economic events on FX Leaders economic calendar
- Trade better, discover more Forex Trading Strategies
- Open a FREE Trading Account


