The 100 SMA Continues to Keep AUD/USD Bullish
AUD/USD retraced lower yesterday, but the retrace ended right at the 100 SMA once again and bounced higher from there
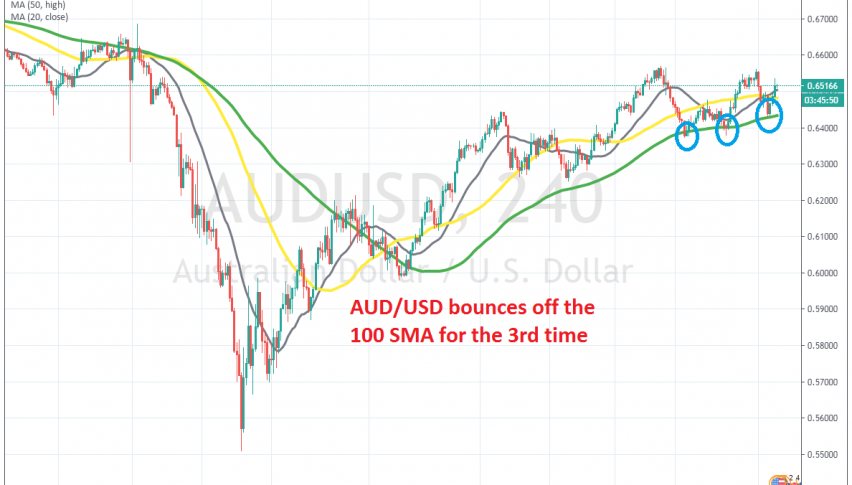
[[AUD/USD]] made quite a comeback in the second half of March, which followed a 12 cent crash in the first half of that month. The climb higher continued in April as well and this pair claimed back almost all the losses from the crash in March, so this pair has performed the best during this time.
Moving averages have been doing a good job during this bullish move, providing support during pullbacks lower. The 20 SMA (grey) and the 50 SMA (yellow) have ben helping, but the main support indicator for AUD/USD on the H4 chart has been the 100 SMA (green), which has provided solid support several times.
This month in particular, we have seen this moving average do so twice, while yesterday AUD/USD retraced lower again, as the USD attracted some bids. But, the 100 SMA held once again as support. I was thinking about going long there, but we already had a buy signal in NZD/USD, which is the same thing as going long on AUD/USD. We stood aside on this pair and today we booked profit on NZD/USD. So, this pair remains bullish and if we see another pullback at the 100 SMA, we might go long.
- Check out our free forex signals
- Follow the top economic events on FX Leaders economic calendar
- Trade better, discover more Forex Trading Strategies
- Open a FREE Trading Account
Related Articles


Comments
Sidebar rates
Related Posts
