The 100 SMA Is Keeping Gold Supported, As the Wedge Narrows
GOLD turned quite bullish as soon as this year started, after a retrace in Q4 of 2019, as a result of the Phase One deal between US and China. But, the tensions between US and Iran in January and then the outbreak of coronavirus turned the sentiment negative in financial markets and safe havens such as Gold have been surging.
Gold climbed up to $1,700 by early March as panic set in, but then lost all the gains and retreated back down to $1,450, as markets turned to the USD as a world reserve currency. But, the decline ended and the attention turned to Gold once again.
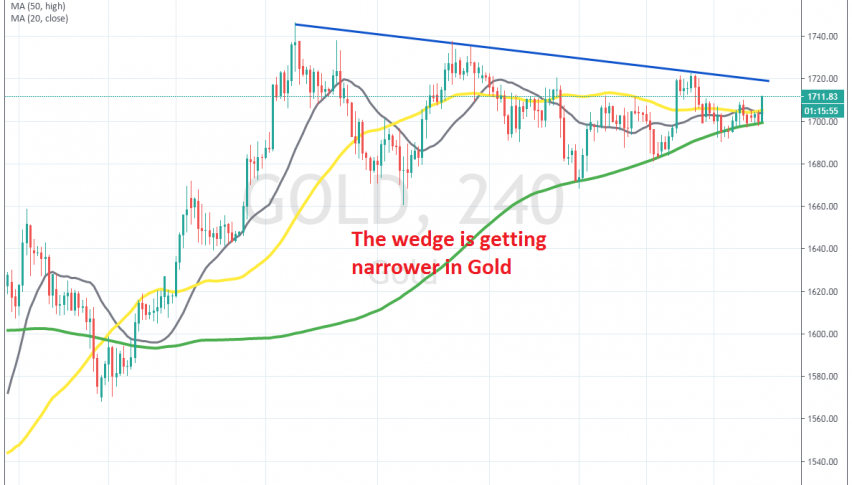
Gold surged back up again, approaching $1,750 by the middle of April, but stopped the climb there and since then, we have seen Gold trade sideways. In Fact, a wedge has been forming on the H4 chart, as shown above. The highs have been getting lower in Gold, while on the bottom side we have the 100 SMA supporting Gold during the pullbacks and pushing it higher.
Towards the end of last week we saw another pullback lower, but the 100 SMA held well yesterday and today it pushed the price back up. So, Gold continues to remain supported by the 100 SMA on this time-frame chart, so we will try to go long form there, after missing the opportunity earlier today although the range is getting quite narrow, so a breakout is due soon in any direction.


