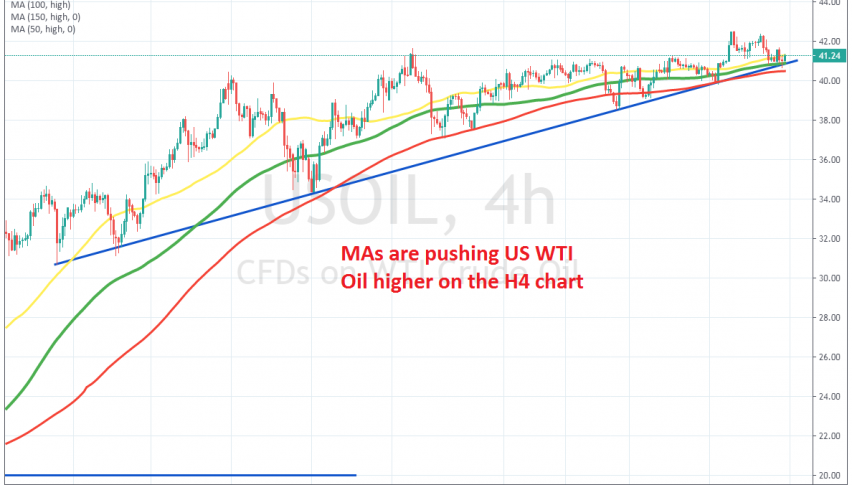
Moving Averages and the Trend Line Hold Oil Up


Crude Oil has been bullish since it reversed, after the crash in April which took US WTI crude to -$37. During the first period of the bullish trend, the pace of the climb was quite strong, with crude Oil increasing around $70 in a month, from -$37 to $33.
The pressure during the second part of the bullish trend has been less strong, but Oil has advanced higher nonetheless. In the first week of June, WTI crude broke above the $40, which was a sign that the crash was over and buyers were back in the game.
Although, there was not much of a follow through after that break. Oil has made new highs at $1.60 at the end of June and at $42.50 last week, but the pace has slowed, although moving averages and the ascending trend line which connects the lows have been keeping US Oil well supported. At the end of last week we saw Oil retrace lower as Russia and OPEC agreed to increase production, but the moving averages and the trend line provided support again. So, we will try to buy pullbacks lower on the H4 chart, since the pressure is still to the upside.