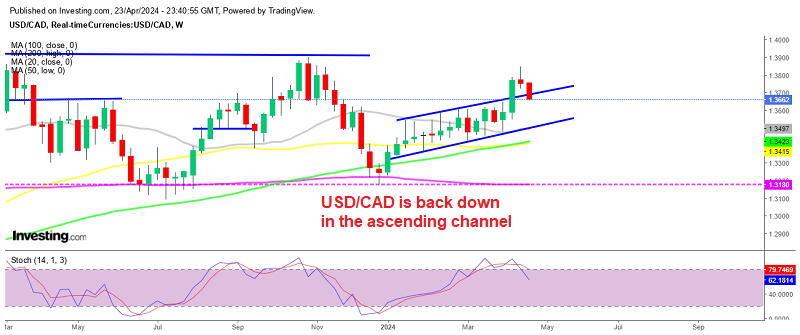
USD/CAD Failed at the 200 SMA in the First Attempt


USD/CAD has been really bearish since March 20, follwing the 15 cent surge higher earlier that month. We have seen 2 strong declines but overall, the trend has been steady, with highs getting lower and lows falling lower as well, losing more than 15 cents from the top.
On the daily chart, the 20 SMA was providing resistance, while on the smaller charts, all MAs have taken their turn. Earlier this month, the price moved above moving averages, but returned back down as the USD weakened considerably during this time.
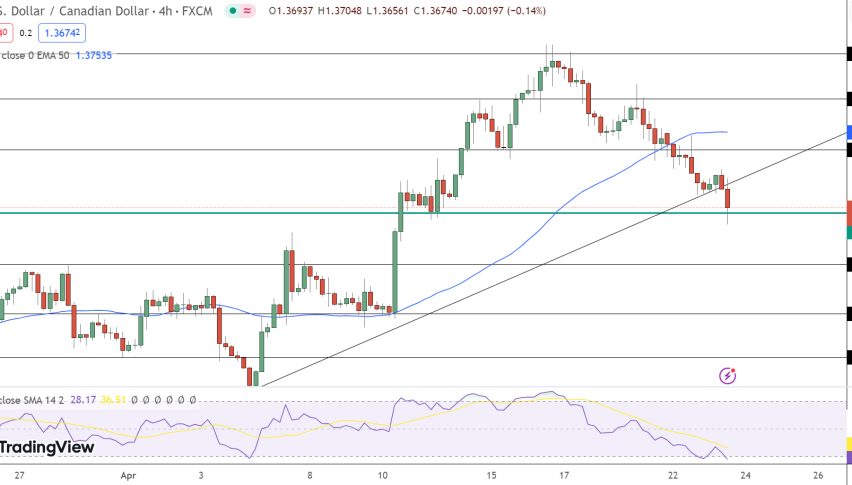
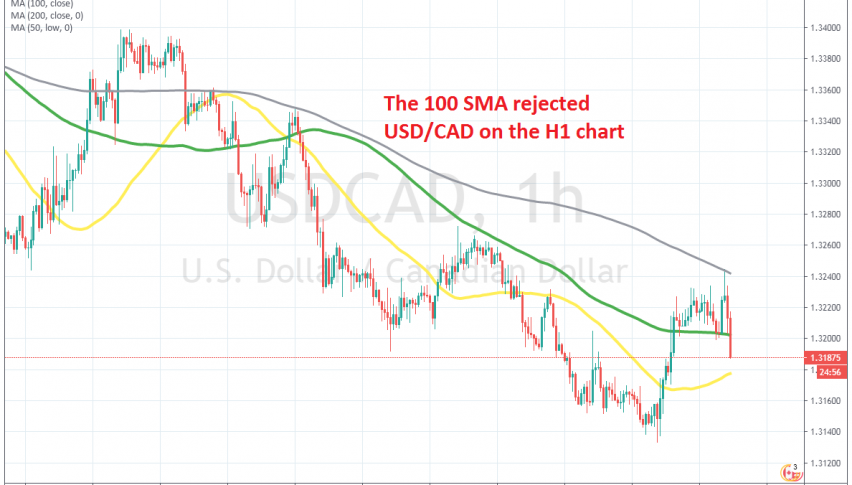
Although, we saw a reversal yesterday as the USD springed back to life. USD/CAD climbed more than 100 pips higher, moving above the 50 SMA (yellow) and he 100 SMA (green). But the 200 SMA (grey) sopped the climb for the second time, after doing so more than a week ago. Now the price has reversed downand is trading at the 100 SMA. Actually, the 100 SMA has ben broken, so the retrace higher is over.