Getting Ready to Sell NZD/USD at Moving Averages


NZD/USD has been bullish since March, climbing around 17 cents from the bottom. The trend has been strong during this time and moving averages turned into support on the daily chart, with the 50 SMA (yellow) holding well during pullbacks lower and pushing NZD/USD higher.
But the uptrend came to an end as soon as summer ended. This pair started reversing lower on September and lost nearly 200 pips during the initial decline. The 50 SMA turned into resistance on the H4 chart, right after the price slipped below it.
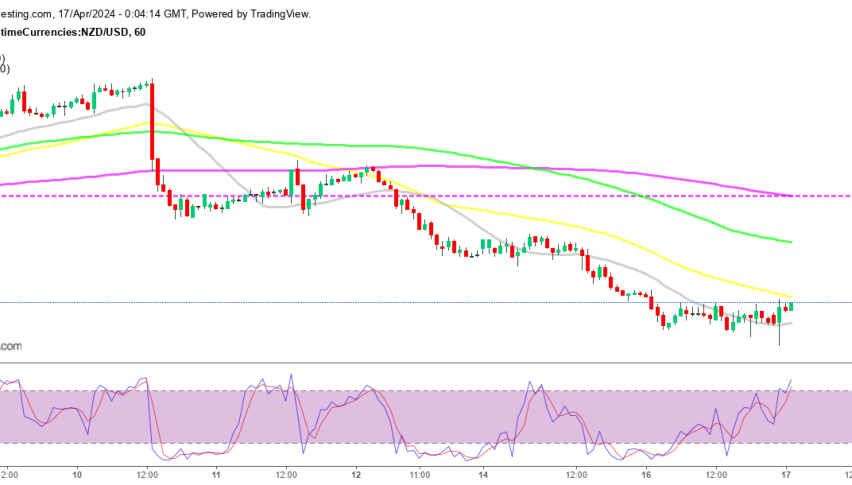
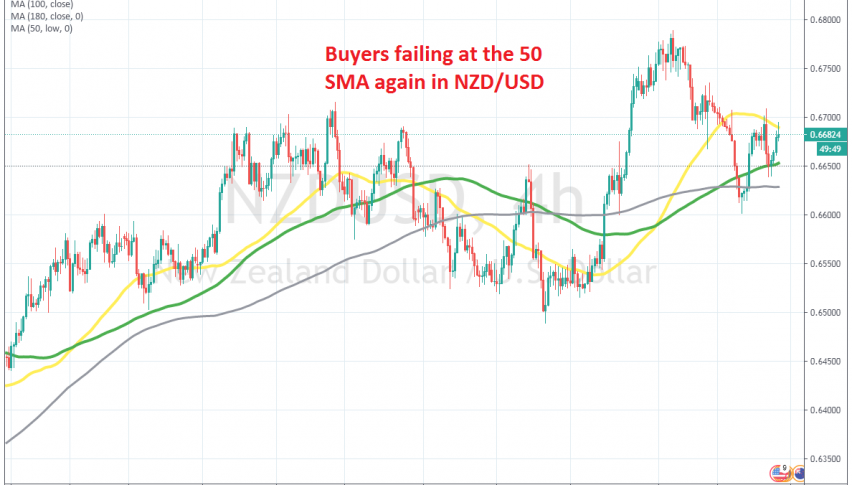
But, the price retraced higher on Tuesday, climbing more than 100 pips and piercing the 50 SMA briefly. But that didn’t count as a break, since the H4 candlestick closed below it. The 50 SMA rejected the price but the 100 SMA (green) held as support and today buyers are trying the 50 SMA again.
Although, the 200 SMA (grey) is adding to the resistance on the H1 chart, while buyers seem exhausted now. We are getting ready to open a sell forex signal below the 50 SMA, but might wait for the US CPI inflation report to be released first. Although, I don’t expect it to have too much impact on the USD, unless it is way off the consensus of around 0.2%-0.3% for both, headline and core CPI.