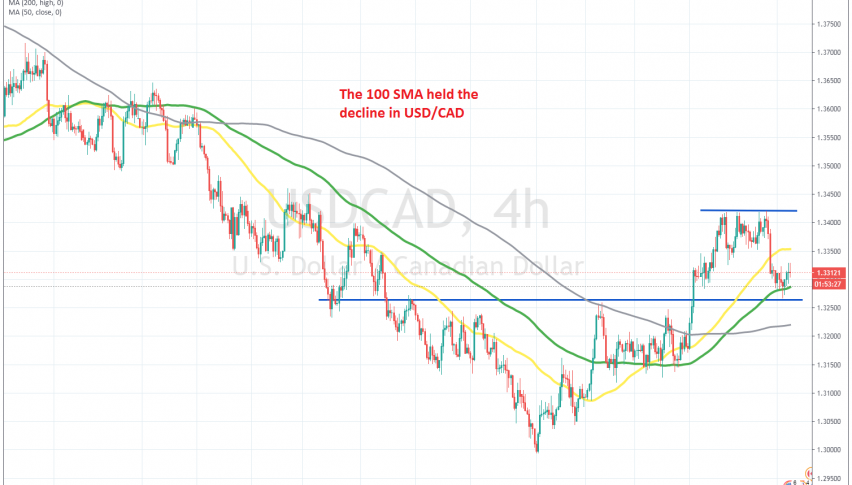
The 100 SMA Still Holding As Support for USD/CAD


The USD/CAD was on a strong bearish trend from March until the beginning of September. Crude Oil was climbing higher for several months, following the crash in US WTI to -$ 37 in April. That kept the CAD supported, sending the USD/CAD from 1.4660 to below 1.30 for a brief moment.
But, the price didn’t stay below 1.30 for too long, so that big round level didn’t count as broken, and USD/CAD reversed higher again. During the decline, moving averages were providing resistance during retraces higher, pushing the price lower in this pair, and the 200 SMA (gray) tried to stop the reversal for some time on the H4 chart. Crude oil is turning lower, which is keeping the pressure up for the USD/CAD.
But, the 100 SMA (green) turned into support for the USD/CAD, and after the consolidation following the first wave up, buyers pushed higher again from the 100 SMA. Last week, the USD/CAD pushed 300 pips higher, as the USD gained some momentum, but a resistance area formed around 1.3420, and the USD/CAD retraced lower again.
But, the 100 SMA is acting as support once again, holding during the decline. So, the trend seems to be turning bullish for the USD/CAD, as lows get higher, and we will try to get in on the long side if an opportunity arises, probably buying at the 100 SMA.