Buyers Back in Charge, as the EUR/USD Moves Above the 50 Daily SMA
The EUR/USD has been quite volatile since August, after climbing around 12 cents in the previous months. The USD turned quite bearish when the coronavirus pandemic broke out in the US, and the Euro took advantage of that, despite the situation in Europe being worse.
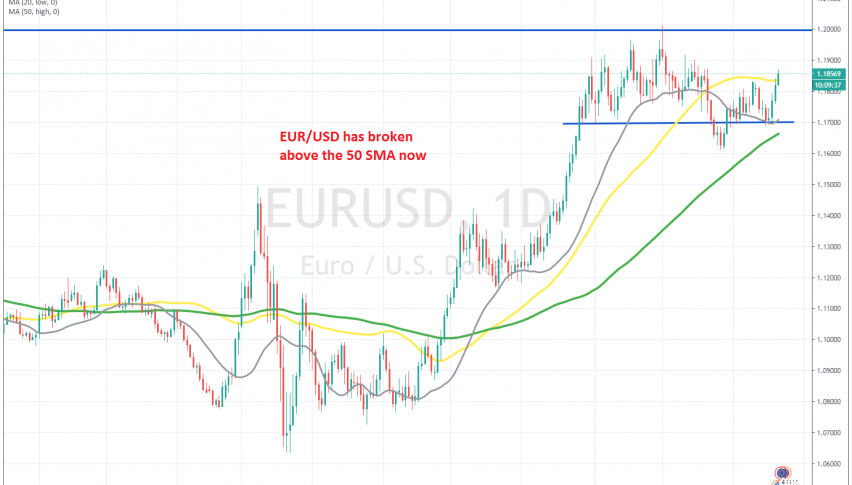
But, the climb stopped, and for more than two months we have seen this pair bounce up and down, without any clear direction. We saw a dip to 1.16 at the end of September, but buyers came back again and reversed the price higher. But, the EUR/USD reversed down below the 50 SMA (yellow) on the daily chart last week.
That was a signal that the bullish trend really had come to an end, since the support indicators, such as the 50 SMA, were turning into resistance, and the highs were getting lower. But, that doesn’t seem to be the case anymore. The price bounced off the 20 SMA (gray) on Monday, after forming a doji candlestick.
That is a bullish reversing signal after the decline, and the 50 SMA has been pierced now. So, the USD won’t be going anywhere until the US elections are over. The price might still pull back lower, and close the day below the 50 SMA, which would be a bearish signal, but for now the buyers are in control.


