Gold Expected to Break out of MAs Soon, as the Range Narrows
Gold has been bouncing between 2 MAs, but they are closing in
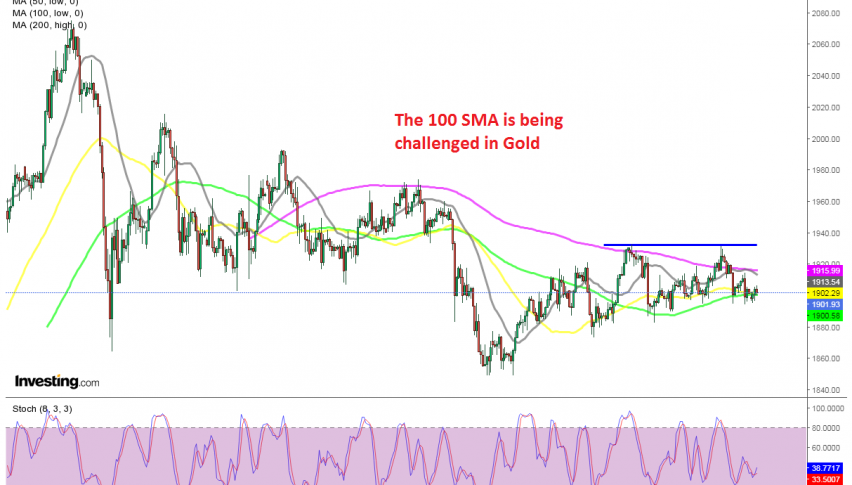
Gold was trading with a strong bullish trend from the beginning of the year, until the first week of August, when it turned down from above $ 2,000. Since then, the highs have been getting lower, which means that the trend has changed on lower time-frame charts.
Since the middle of September, we have seen the 200 SMA (purple) provide resistance on the H4 chart. This moving average has been rejecting gold during pullbacks up, pushing the highs lower, although we saw the price pierce this moving average early last week.
The previous high at $ 1,932 held, and this level turned into resistance. The price turned lower form there, but the 100 SMA (green) is acting as support on this time-frame chart. This moving average has been pierced as well, but it is holding the price above it nonetheless.
So, gold is bouncing between these 2 MAs, but the range should be broken soon, as MAs squeeze gold in between them. It remains to be seen which way the break will come, but we will probably trade the breakout in either direction.
- Check out our free forex signals
- Follow the top economic events on FX Leaders economic calendar
- Trade better, discover more Forex Trading Strategies
- Open a FREE Trading Account
- Read our latest reviews on: Avatrade, Exness, HFM and XM
Related Articles


Sidebar rates
Related Posts
