The 50 SMA Continues to Keep Crude Oil Bullish


Crude oil has been trading on a bullish trend since April, when it came back from the abyss it fell into that month. The first wave of the uptrend lasted until the end of August, when US WTI crude increased to $ 43.50, where it found solid resistance for several weeks.
In September and October, we saw a pullback lower, and the price fell to $ 33.50s by the beginning of November, right before the US elections. That didn’t last long though and crude oil turned bullish again. Buyers have been in charge for over a month now, and moving averages are helping to keep oil prices bullish.
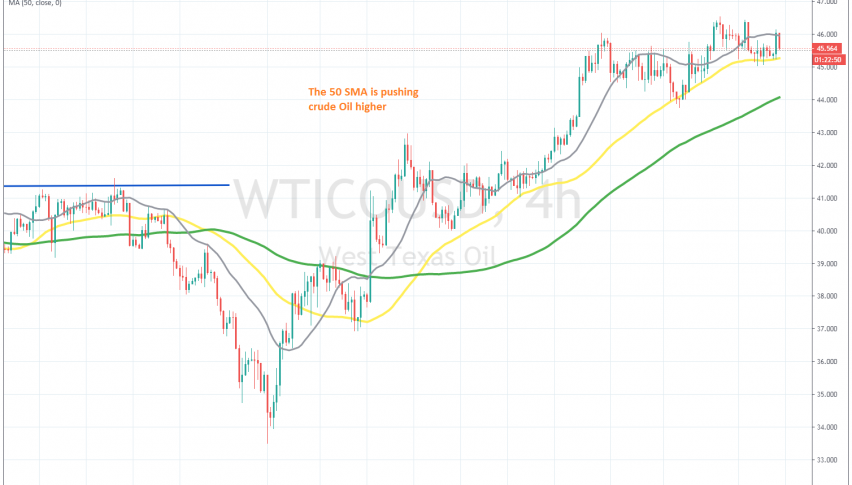
Looking at the H4 chart, we can see that the 50 SMA (yellow) turned into support for crude oil in the first test from the upside, after the reversal higher. This moving average has been increasing, and it has been pushing oil higher, working as support during pullbacks lower.
The 50 SMA has been providing support, and earlier today we saw the latest bounce higher. Although the jump stopped at the 20 SMA (gray) and it is pulling back down now. We are following the price action to see if we can buy off the 50 SMA once again, although we will wait for a bullish reversing signal before pulling the trigger.