Selling the Retrace Higher in USD/JPY


Safe havens have been on a bullish trend as a result of the coronavirus and the economic/political changes that have taken place this year. USD/JPY has been quite volatile, going through a major crash in march, but then reversed back up. Although, the sentiment remained bearish for this pair, from around 1.12 to below 1.03.
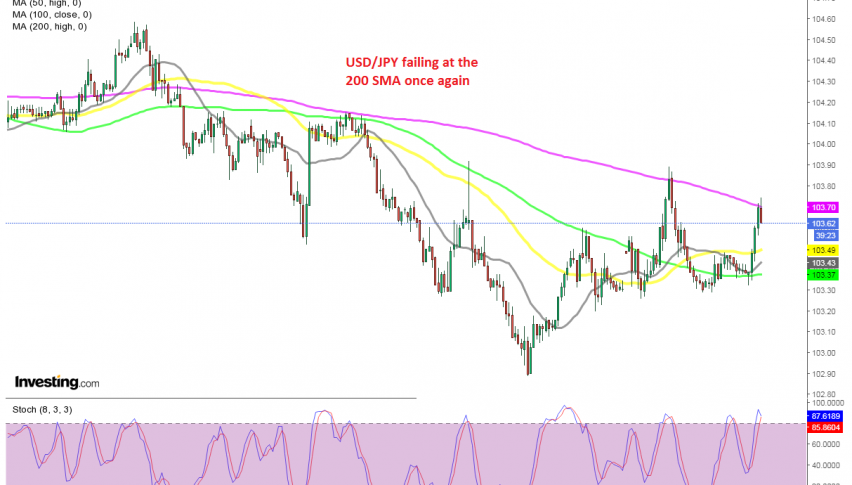
The downtrend has been straightforward, with moving averages providing resistance during pullbacks higher and pushing the trend down on the daily chart, particularly the 50 SMA (yellow). On the H1 chart, the 200 SMA (purple) has been the ultimate resistance for USD/JPY this month.
This moving average has been providing resistance several times recently, bringing an end to all retraces higher on this time-frame chart. Today we saw another such retrace take place when the US session opened, as the price bounced off the 100 SMA (green). This moving average turned from resistance into support today, but the bounce seems to have ended at the 200 SMA.
We opened a sell forex signal below this moving average and now the price is starting to reversed back down again, so we are witnessing another rejection of USD/JPY by the 200 SMA. The stochastic indicator is also overbought and reversing down, so the chart setup is pointing down for USD/JPY. Our signal looks aright for the moment.