Is the Retrace Over at the 100 SMA for Crude Oil?


Crude Oil has been increasing since April, first reaching to $ 43.50 where it found resistance for some time in summer, then after a $ 10 pullback lower in Autumn, the bullish trend resumed again. The big level at $ 50 was expected to provide resistance for some time in the WTI Oil, but it got broken quite easily.
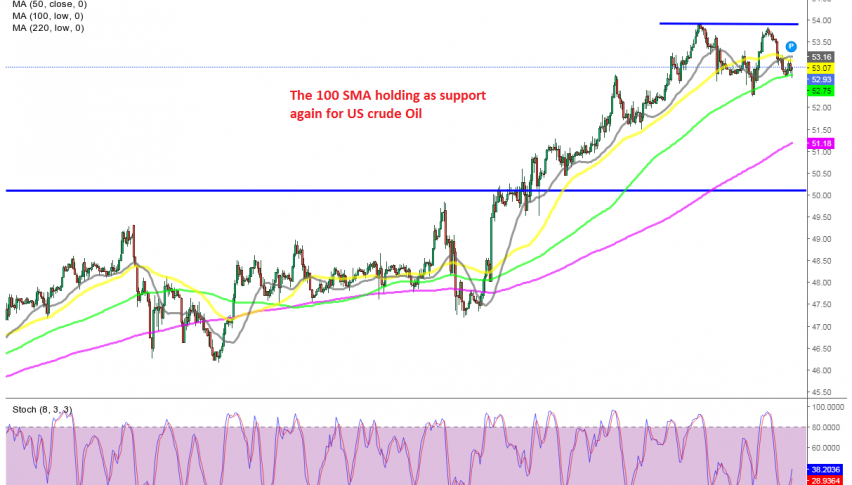
Moving averages have been doing a great job during this time, providing support during pullbacks lower and pushing Oil prices higher. On the H1 chart below, the 50 SMA (yellow) and the 100 SMA (green) has been providing support during January, with the trend picking up pace.
Although, the bullish move came to an end at $ 54 on Wednesday, where it reversed down, losing more than 150 pips. But, the 100 SMA held as support on the H1 chart and yesterday the price bounced off that moving average. Buyers couldn’t push above the Wednesday high though and the price reversed back down. But the 100 SMA is acting as support once again. The stochastic indicator is oversold on this time-frame, so this looks like a good opportunity to go long, targeting 100 pips below $ 54.