Selling AUD/USD at the 100 SMA, Which Has Turned Into Resistance
AUD/USD is finding it hard to push above the 100 SMA, so we decided to open a sell forex signal
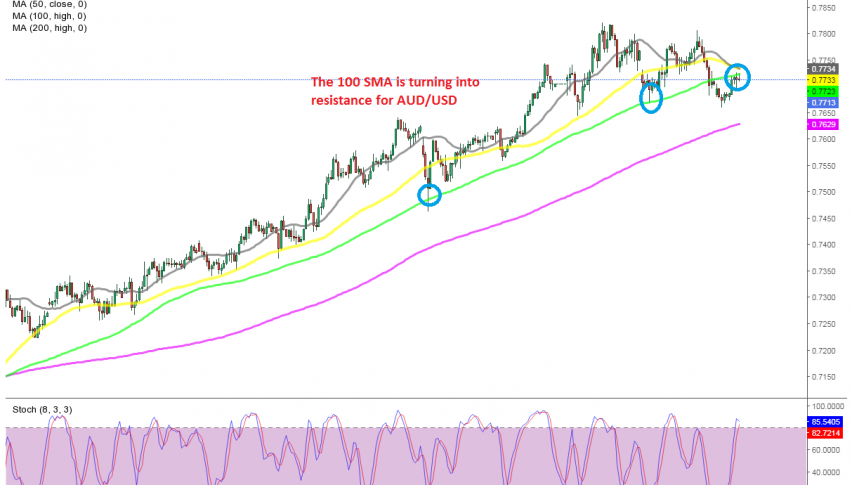
[[AUD/USD]] has been on a bullish trend since the middle of March, when it reversed form the initial coronavirus crash. In September and October we saw a retrace lower, but the pullback ended after the US presidential elections and this pair resumed the bullish trend, gaining more than 23 cents from the bottom.
During this time, moving averages have been doing a great job working as support, particularly the 50 SMA (yellow) and the 100 SMA (green). AUD/USD has been finding solid support at these moving averages on retraces lower, turning bullish after stochastic became oversold.
Although, last week we saw a deeper pullback and this forex pair fell below the 100 SMA for the first time since early November. Yesterday we saw an attempt at reversing the price higher, but it seems like buyers are finding it hard to push above the 100 SMA, which might be turning into resistance now. We decided to go short here, since the stochastic indicator is overbought and the last candlestick looks like a doji, which is a bearish reversing signal.
- Check out our free forex signals
- Follow the top economic events on FX Leaders economic calendar
- Trade better, discover more Forex Trading Strategies
- Open a FREE Trading Account
- Read our latest reviews on: Avatrade, Exness, HFM and XM
Related Articles


Sidebar rates
Related Posts
