Anyone Buying USD/JPY at the 100 SMA?


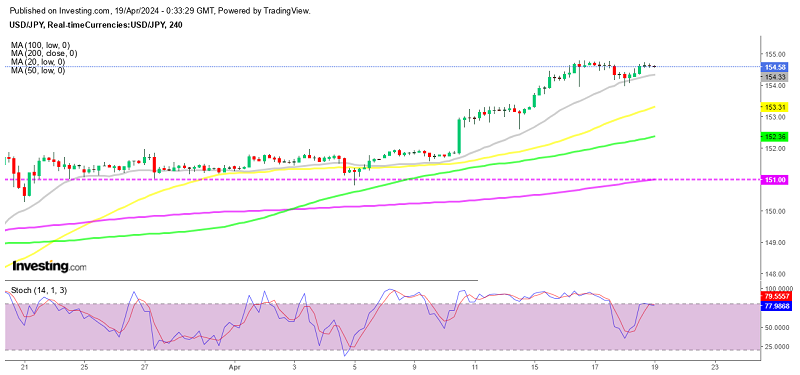
The USD/JPY has been trading on a bearish trend since March, after a 12 cent crash back then, which was followed by a bearish reversal. During this time, moving averages have been doing a great job as resistance, pushing the price lower, particularly the 50 SMA (yellow) on the daily chart.
On the H4 chart, the 100 SMA (green) and the 200 SMA (purple) have been providing solid resistance at the top. The price has lost around 9 cents from top to bottom, although after the first week of January we saw a reversal higher in this pair, as safe havens somehow lost their appeal.
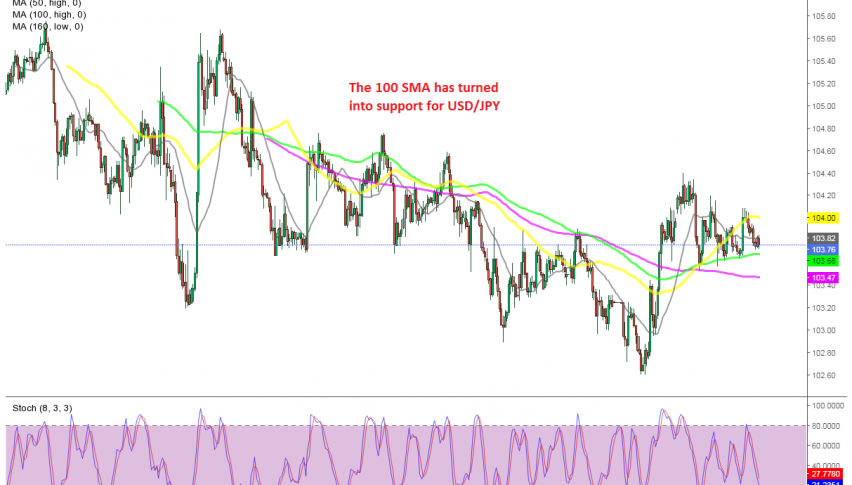
The price moved above the moving averages on this time-frame chart, and the 100 SMA turned into support immediately. This moving average has been holding as support during several attempts to turn the pair bearish again. The USD/JPY bounced off the 100 SMA, but it is returning down to it again today. We have left a pending order to buy just above the 100 SMA, since the stochastic indicator is oversold on the H4 chart now .