Anyone Trading the Range in Gold, As It Bounces Between 2 Moving Averages?


Traditional safe havens look confusing in 2021. GOLD and SILVER turned bullish after the coronavirus broke out in Europe in March last year and remained so until August, with Gold climbing above $ 2,000 for about a week. Although that didn’t last and the precious metals turned bearish again.
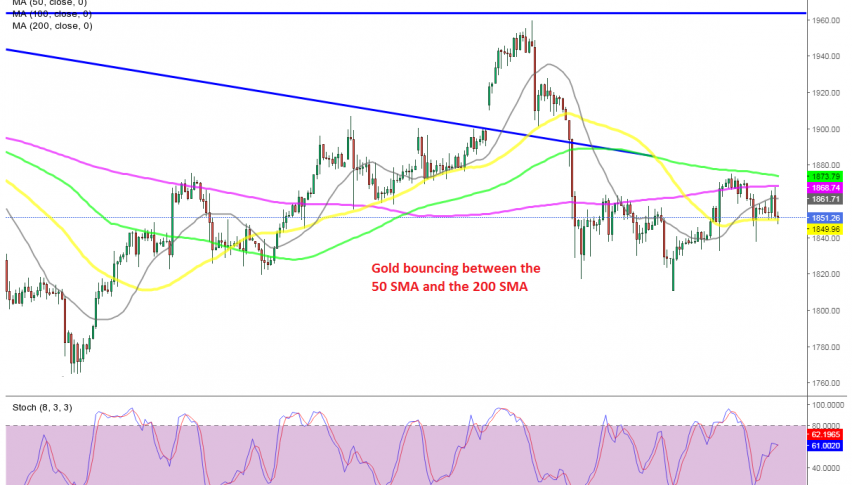
Gold fell more than $ 300 until December, but reversed higher last month, as the decline in the USD escalated further. Although, earlier this month Gold turned down again, falling around $ 150. But, since then the price has been trading sideways, bouncing up and down.
Last week Gold moved above the 20 SMA (gray) and the 50 SMA (yellow) on the H4 chart, which turned into support immediately. At the top, the 200 SMA (purple) which has been acting as support and resistance before turned into resistance again reversing the price down.
Although, the 50 SMA held as support today and we saw a bounce off that moving average after a doji candlestick, which is a bullish reversing signal. We missed the chance to buy Gold down at the 50 SMA, but will follow the price action to see if we can sell at the top where the 200 SMA stands. If we get a reversing signal up there, then we might go short on Gold.