Going Long on Bitcoin at the 50 Daily SMA
Bitcoin has retreated around $10,000 lower, bu found support at the 50 daily SMA
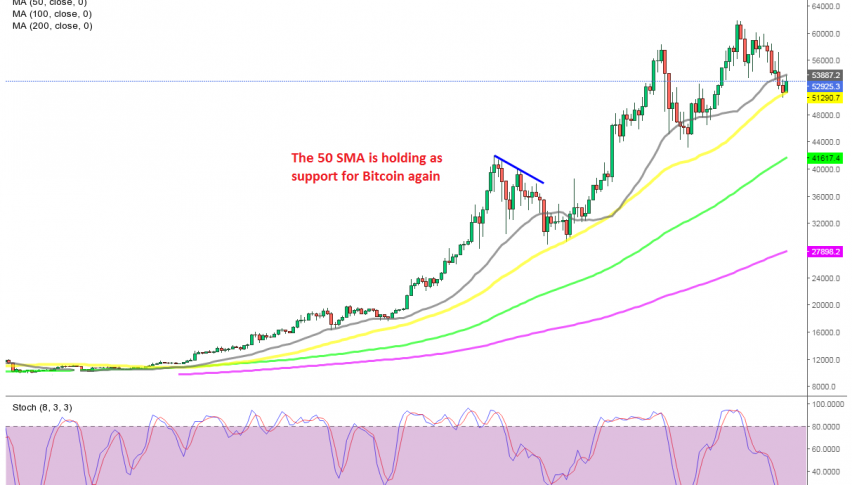
Cryptocurrencies are in the middle of another pullback lower, after giving the upside another shot earlier this month. Bitcoin made new highs this month, pushing above $60,000 by the middle of the month, but it didn’t stay there for too long.
It started retreating lower last week and this week it fell to $51,300. Although, the retreat stopped at the 50 SMA on the daily chart, which has been a solid support indicators before, together with the 20 SMA (gray).
The stochastic indicator became oversold, which means that the retrace is complete on this time-frame chart. As a result, we decided to open a buy forex signal on BITCOIN last night, based on the daily chart.
Today Bitcoin has bounced off that moving average and is trading around $ 2,000 higher, so it seems like the pullback is over and the bounce has already started. We are holding on to this trade for a few days, to see where it will take us.
- Check out our free forex signals
- Follow the top economic events on FX Leaders economic calendar
- Trade better, discover more Forex Trading Strategies
- Open a FREE Trading Account
- Read our latest reviews on: Avatrade, Exness, HFM and XM
Related Articles

Sidebar rates
Related Posts
