Will the Pullback in Oil End at the100 SMA or the Previous Support?


Crude Oil turned bullish last week, after trading sideways for about a month. Oil has been bullish long term, with the US WTI climbing from around $-37 to $68, which means a $105 climb from the bottom to the top, but by the middle of march we saw a retreat back down, forming a support area around $57.50.
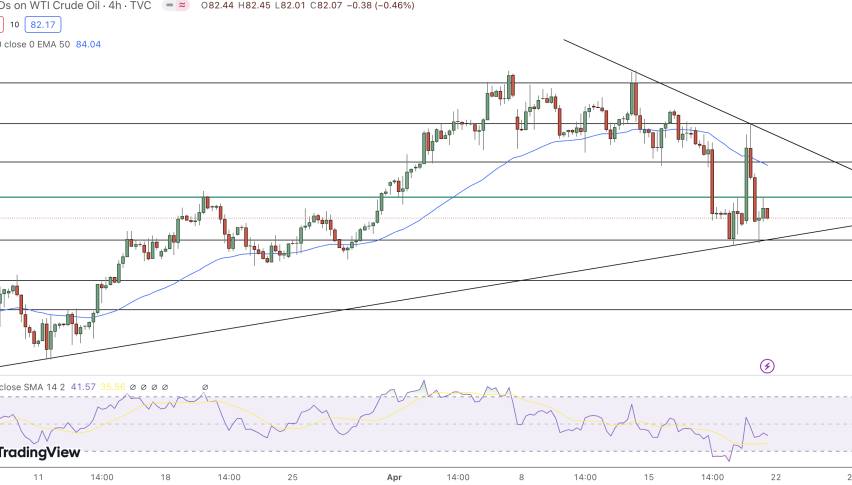
There haven’t been many Oil headlines in recent days, but the risk retreat yesterday is one of the few things influencing price action in crude Oil. Crude Oil turned lower, falling from $64.00 to $61.50 yesterday.
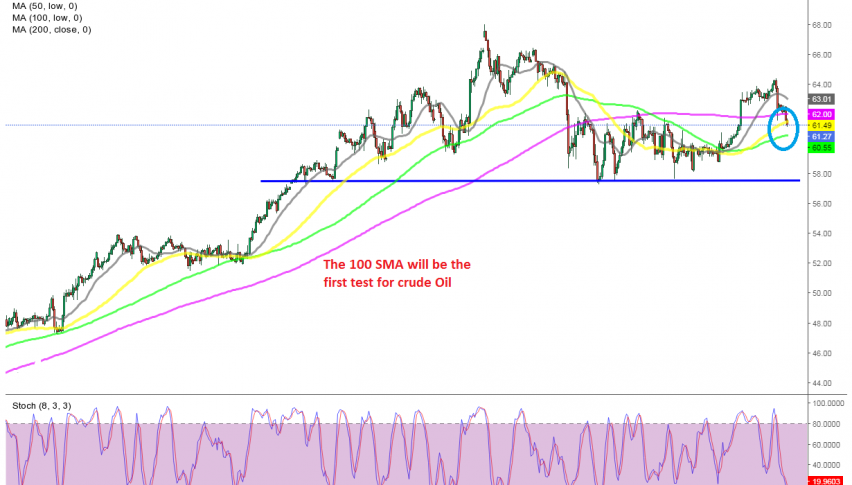
It is trading just above $61 now, after breaking below the 50 SMA (yellow) and the 200 SMA (purple), as well as the 38.2 retracement level at $61.78. Now Oil sellers are in charge, but this decline will likely end at some point, the question is where.
Now that these moving averages have been broken, the next support levels are around $60.00 and then the previous low around $57.50. Although, the 100 SMA (green) which has provided support and resistance before, is standing at around $60.50. So, thee are a few support areas below and we will follow the price action to see at which level the reversal signs come. If we get some signals, we might go long on crude Oil.
By the way, we have heard comments abut OPEC+ skipping its ministerial meeting next week but considering that they have already committed to production quotas over the next few months, there shouldn’t be much to really talk about for the time being.