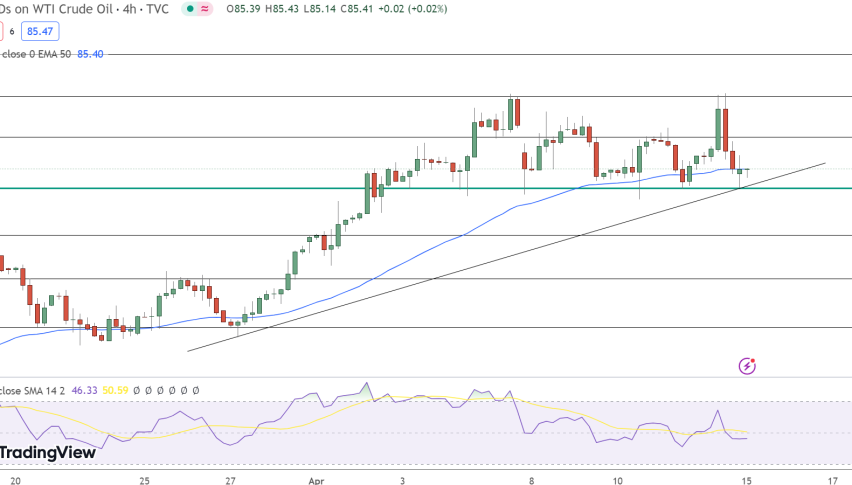
WTI Crude oil closed at $63.86 after placing a high of$ 64.53 and a low of $62.67. Crude oil prices extended their bullish trend and reached above $64 level for the first time since March 18 amid weakness in the U.S. dollar. On Wednesday, WTI oil moved higher after the Energy Information Administration reported a small inventory build of 100,000 barrels for the week to April 23. Oil prices rose about 2% on Wednesday, helped by the bullish U.S. inventory and a Goldman Sachs forecast for the price to touch $80 a barrel within the next six months. This positive forecast, despite the third-largest crude importer India remaining devastated by one of the world’s worst coronavirus outbreaks, added strength to WTI crude oil prices.
India suffered on Tuesday with the worst day yet of the pandemic as both new infections and death toll broke previous records. Despite such negative developments in India, US oil managed to post gains on Wednesday amid broad weakness in the dollar. The U.S. Dollar Index that measures the greenback’s value against the basket of six major currencies fell to 90.53 level after the U.S. treasury yields on the 10-year note fell to 1.60% from 1.65%. The decline in the U.S. dollar was due to the latest comments from Fed chair Jerome Powell, who said that the Fed would continue to support the economy till full employment is achieved. Powell also said that asset purchases would not be reduced in the coming months despite successful vaccination rollouts and improved economic conditions. These comments weighed on the greenback and supported a hike in crude oil prices.
On the data front, at 17:30 GMT, the Goods Trade Balance from the U.S. fell to -90.6B against the predicted -88.2B and weighed on the U.S. dollar that added strength in crude oil prices. The Prelim Wholesale Inventories improved to 1.4% against the expected 0.5% and weighed on the U.S. dollar and also pushed crude oil higher. At 19:30 GMT, the Crude Inventories from the U.S. rose to 0.1M against the expected -0.9M and weighed on the U.S. dollar that added further crude oil prices.
Daily Technical levels:
Support Resistance
62.85 64.71
61.83 65.55
60.99 66.57
Pivot Point: 63.69