The BTC/USD crypto pair failed to extend its previous day long bullish rally and dropped $6K around well below $53,600 as the crypto market lost $200 Billion in the past 24 hours. It has failed to break the $60,000 barrier, and was climbing high in the past few days. The cryptocurrency leader hit its three-week highest level at $59,600 yesterday. But the gains were short-lived as BTC started to lose value fast in the following hours. As a result, the primary crypto dropped by more than $6,000 to an intraday low of just below $53,600.
In addition to BTC, the alternative coins were performing more amazingly than their leader in the past few weeks. However, most of them followed the bearish bias and dropped yesterday as well. Binance Coin (-5.5%), Ripple (-10%), Cardano (-7.5%), Polkadot (-12%), Bitcoin Cash (-12%), Litecoin (-12%), and Chainlink (-12%) all faced losses.
The drop in values could be attributed to the recent declines in the global stocks like S&P 500 SPX, -1.04%, Dow Jones Industrial Average DJIA, -0.10%, and the Nasdaq Composite Index. Apart from this, the losses were further bolstered by the stronger U.S. dollar. The prevalent bullish bias around the U.S. dollar was mainly sponsored by the downbeat market sentiment, which tends to undermine safe-haven assets like the U.S. dollar. The BTC/USD pair price is trading well below the 55,624.3 level and consolidating in the range between 54,550.4 and 56,384.2, at the time of writing.Across the ocean, the crypto market cap also declined by about $200 billion at one point after yesterday’s record above $2.5T. This, in turn, becomes another key factor that puts downside pressure on the BTC/USD crypto pair. Meanwhile, the losses in cryptocurrencies could also be attributed to the recent drops in global stocks. It is worth recalling that the Dow Jones Industrial Average ended its previous five-session winning steak on Monday, falling late in the session after pushing above the 35,000 milestones. The broader market came under pressure as high-profile Big Tech shares dropped.

BTC/USD Daily Support and Resistance
S3 44503.53
S2 50415.73
S1 53073.97
Pivot Point 56327.93
R1 58986.17
R2 62240.13
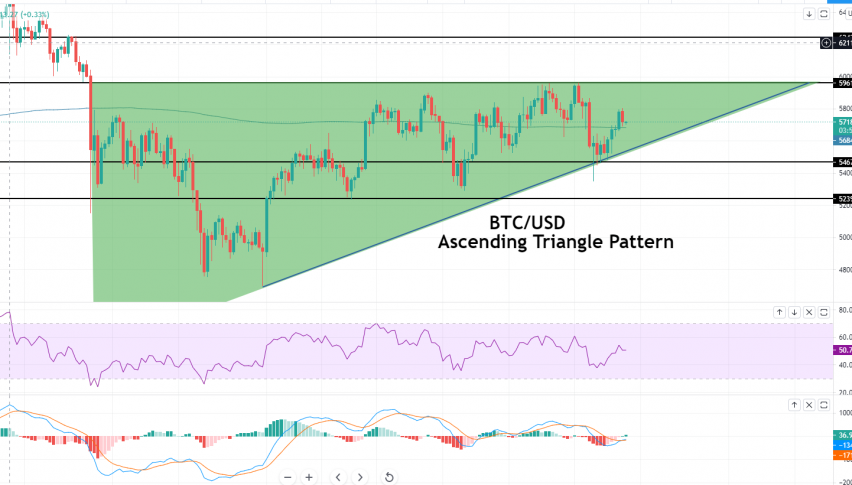
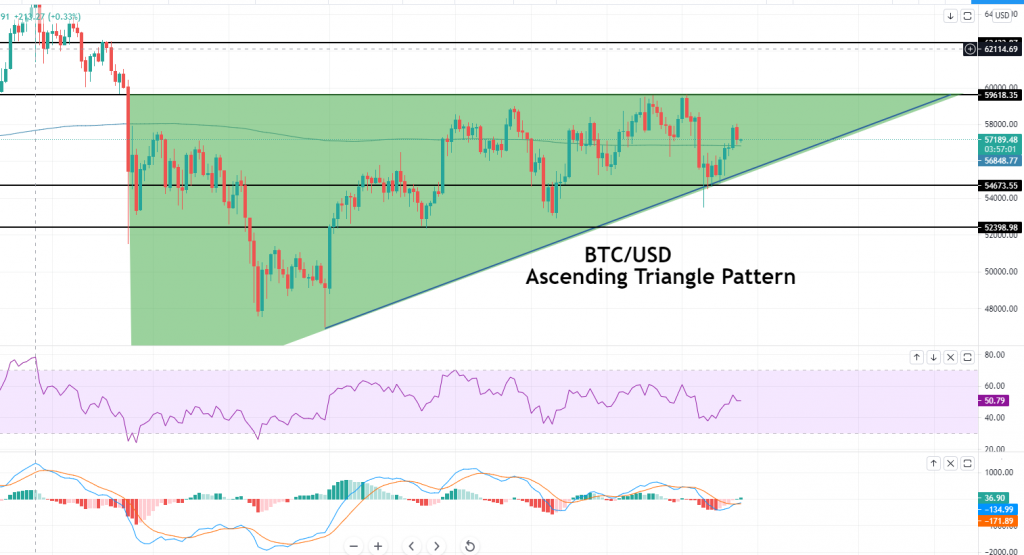
R3 68152.33BTC/USD is trading with a bullish bias at 57,175 level, and it has formed an ascending triangle pattern on the 4-hour timeframe. The pair is likely to face immediate resistance at the 59,618 level, and a breakout of this can trigger buying until the 62,433 level. On the lower side, the support holds around 54,673 levels, and a breakout can lead
BTC lower than the 52,398 level. Let’s keep an eye on the 56,327 level today as the pair can trade bearish below this and bullish above the same. Good luck!