Has A Resistance Zone Formed in US Oil at $67-$68?


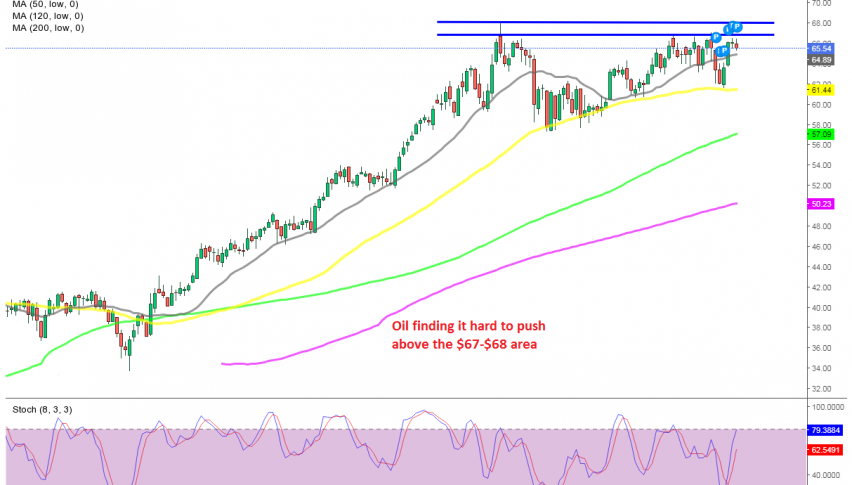
Crude Oil has been bullish since April 2020, after the US WTI crude dived lower to $-37 during the initial shock of the coronavirus outbreak. It has climbed more than $100, as it reached $68 in early March.
We saw a retreat later that month, but the 50 SMA (yellow) held as support on the daily chart, despite being pierced several times. The bullish trend resumed again in April, but buyers have been having trouble pushing above $67 this second time.
We have seen several attempts from buyers, but they have all ended just below that level and today seems like another failure from them. Yesterday’s candlestick closed as doji, which is a bearish reversing signal and today the price is retreating slowly.
Last Friday we saw another bounce off the 50 SMA (yellow) on he daily chart, but buyers couldn’t keep the bullish momentum going. So, it seems like a resistance zone has formed in crude Oil between $76 and $68. We could sell Oil at the top here, but it’s too dangerous, so we are safe buying at the bottom near the 50 SMA.