EUR/USD Makes a Break Above MAs, After US Q2 GDP Misses Expectations


The EUR/USD has turned bearish since earlier this month, as the US economy continues to keep up an impressive pace of expansion, pushing inflation higher. The CPI (Consumer Price Index) inflation reached 5.5% in June, after increasing to 5.1% in May. This has forced the FED to reverse the rhetoric slightly, from really dovish to less dovish, with some hawkish comments here and there.
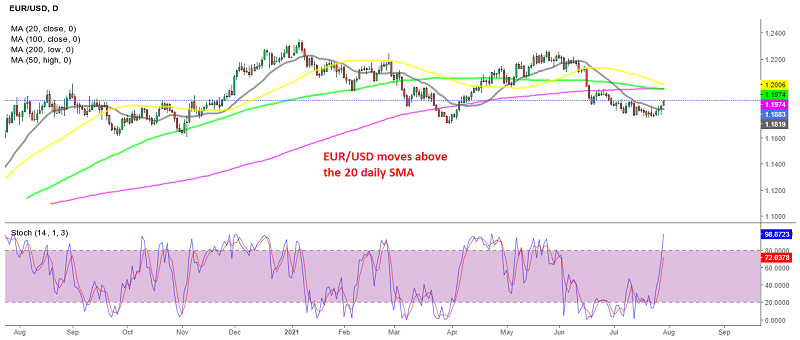
At the same time, inflation in Europe remains steady at around 2% for headline CPI and around 1% for core CPI. So, the divergence in inflation turned the EUR/USD bearish, although yesterday the FED statement missed market expectations, sounding less hawkish than anticipated, which sent the USD down and the EUR/USD above the 20 SMA (gray) on the daily chart, where it had been for about a month.
Today, the GDP report showed another quarter of decent economic expansion, at 6.5%, but it still came in lower than the expectations of 8.5%, which is keeping the pressure to the upside for this pair. Below is the US GDP report:
Highlights of the first look at Q2 GDP
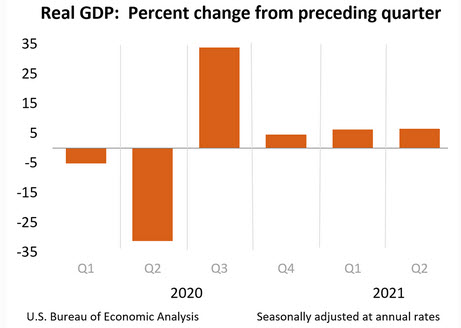
- Q2 advance GDP +6.5% vs +8.5% expected
- Q1 was +6.4% annualized
- Personal consumption +11.8%
- GDP price index +5.7% vs +5.4% expected
- Core PCE +6.1% vs +5.9% expected
- 2020 GDP revised to -3.4% from -3.5%
- GDP final sales +7.7%
Details:
- Inventories cut 1.13 pp from GDP vs -2.67 pp in Q1
- Business investment +8.0% vs +11.7% prior
- Business investment in equipment +13.0% vs +15.0% prior
- Exports +6.0% vs -2.1% prior
- Imports +7.8% vs +9.5% prior
- Trade was a 0.44 pp drag on GDP vs -1.56 pp in Q1
- Home investment -9.8% vs +13.1% prior
- Consumer spending on durables +9.9%
- Personal consumption added 7.78 pp to GDP
- Government spending cut 0.27 pp from GDP vs +0.77 pp prior
- Full report