Polygon (MATIC): The Bulls are Back
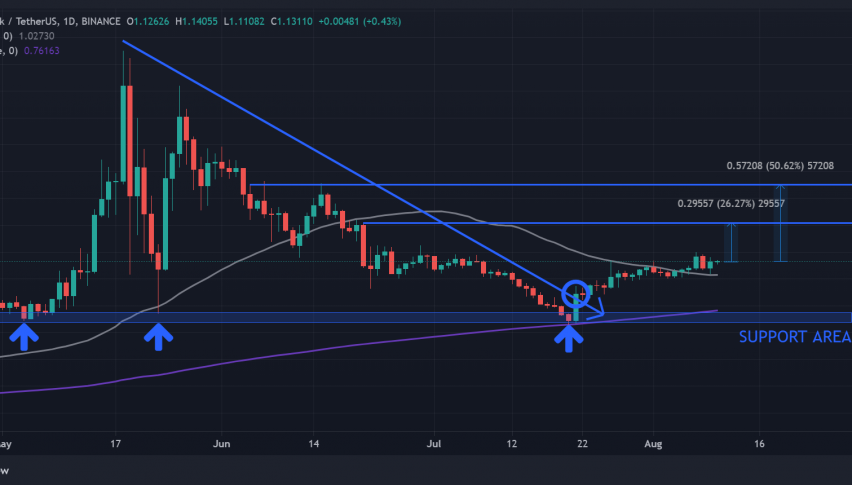
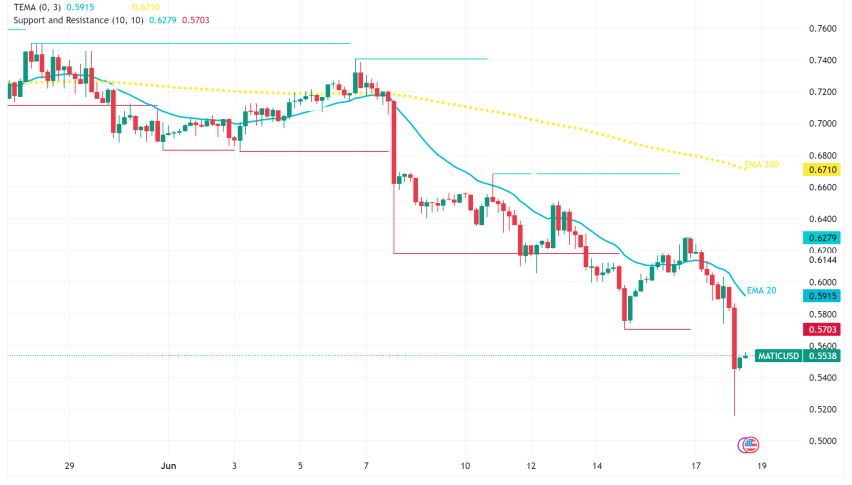
*MATIC bounced above the support area: 200-day moving average (purple line) and broke above its midterm downtrend line
Polygon (MATIC) is one of technically stronger cryptos, as it has never fallen below its 200-day moving average, in comparison to most cryptocurrencies that have turned bearish and fallen below this critical dynamic line.
The 200-day moving average is a long-term moving indicator that technical analysts use to gauge the bullishness or bearishness of a stock or cryptocurrency. A cross below it indicates weakness and a bearish sentiment, whereas a cross above it indicates strength and a turn towards bullishness.
MATIC has actually bounced off this critical moving average strongly, and has never looked back since. Coincidentally, the area where it bounced is also a major support area (0.6000 to 0.7500). It has found strong buying demand somewhere in this zone at least three times this year.
-
-
- May 5-8: Price consolidated above this area but never fell below it. Rallied to 2.70 in a few weeks.
- May 23: As the entire crypto market crashed so did MATIC. Down 72% from the highs of 2.70. This major support held up as well. MATIC hit the upper bounds of the support at 0.7500 before bouncing 200% to 2.43 in just four days.
- July 20: It revisited this support zone again, now also reinforced by the dynamic 200-day moving average support line. It fell to 0.62 before rallying more than 50% the following day. It has continued to rally since then.
-
MATIC Trade Idea: Buy the continuation rally
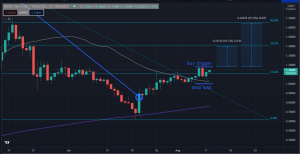
Currently, MATIC is in a consolidation above the 50-day moving average (gray line) which, coincidentally, is also the 23.60% Fibonacci retracement level. If the rally continues, one way to participate is to buy the follow-through at 1.20, at a target price of 1.4000 – the next resistance area is the 38.20% Fibonacci retracement level. Put a tight stop below the 50-day moving average and the psychological whole number support of 1.00.
Trade Summary:
Buy: 1.18 to 1.20 (buy the continuation)
Target: 1.40 (short-term target, 38.2% Fib.)
1.60-1.66 (mid-term target, 50.0% Fib.)
Stop loss: 1.00 (nearest support)
VAR: 1.00 (risk only 1% of your portfolio for this trade)
Polygon (MATIC) is currently the 9th largest cryptocurrency in the market, with a market capitalization of $7.2B. It was founded by Jaynti Kanani, Sandeep Nailwal and Anurag Arjunin, in 2017.
- Check out our free forex signals
- Follow the top economic events on FX Leaders economic calendar
- Trade better, discover more Forex Trading Strategies
- Open a FREE Trading Account
- Read our latest reviews on: Avatrade, Exness, HFM and XM
Related Articles
Sidebar rates
Related Posts
