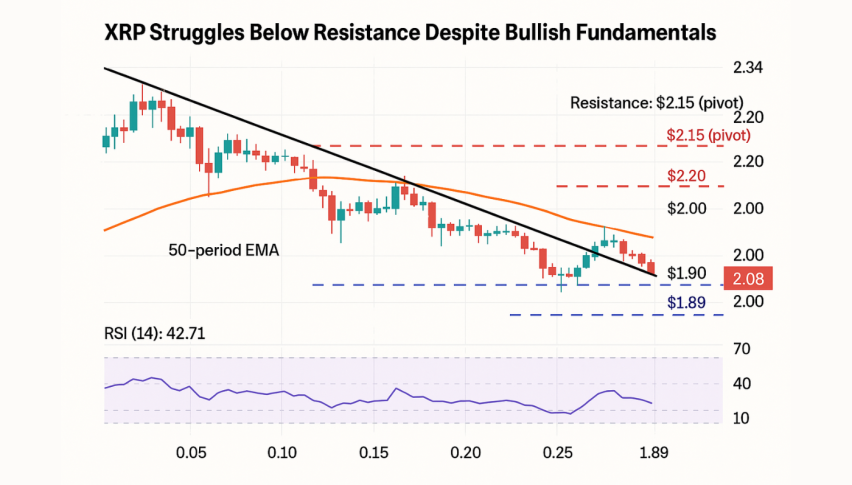
Weekly Chart Points to a Retreat to $35,000 in Bitcoin, Before Pushing to New Highs
Bitcoin started the bearish crash in cryptocurrencies in May, when it dived from under $65,000 to $29,000, and it also started the bullish reversal in cryptocurrencies this month. The bullish reversal came after the 50 SMA (yellow) caught up with the price on the weekly chart.
BTC/USD was severely oversold, as the stochastic indicator shows, while now, after gaining around $19,000, this indicator has reached the overbought area on this chart. Besides that, the 20 SMA (gray) is acting as resistance for Bitcoin now.
This sort of chart setup on the weekly time frame points to a bearish reversal and a retreat down to the 50 SMA once again. If that happened, Bitcoin would be very tempting to buy, since it would be oversold by that time, and the 50 SMA would offer support again. But traders would fear a further retreat to around $30,000 if Bitcoin fell to the 50 weekly SMA.

The 200 SMA might offer support on a pullback lower for Bitcoin
So, we will follow the price action if the price gets there, and see if it forms a bullish reversing chart pattern. However, before that, there are many other levels to watch, to see if the retreat ends there. The 200 SMA (purple) on the daily chart, which acted as resistance during the bearish period, has already turned into support. Below that is the top of the range during the same period, at around $42,000, and then comes the big round level at $40,000.
BITCOIN has shown signs of fatigue in recent days, with gains slowing down and failing to push to $50,000. This indicates some profit-taking after the bullish run that has lasted almost a month. This also supports the idea of a deeper pullback lower, although no one can guess right now where it might end.
In India, the central bank of the country, the RBI Reserve Bank of India, is going to decide soon whether to ban Bitcoin or list it as an asset class. I think that the latter will win, but this might be a factor in this latest retreat.
Bitcoin Live Chart

Sidebar rates
Related Posts
