Ethereum (ETH) and Ripple Coin (XRP) Ready for the Next Bullish Leg


Cryptocurrencies went through a crash last week, which set them back between 25% and 35%. The crash stopped pretty fast, after just a couple of hours, but the sentiment has remained bearish since then, and cryptos have been finding it hard to make gains. But the chart setup in most cryptos is increasingly looking like they are about to resume the bullish trend after this period of pullback and consolidation, which has refreshed the trend in most cryptocurrencies.
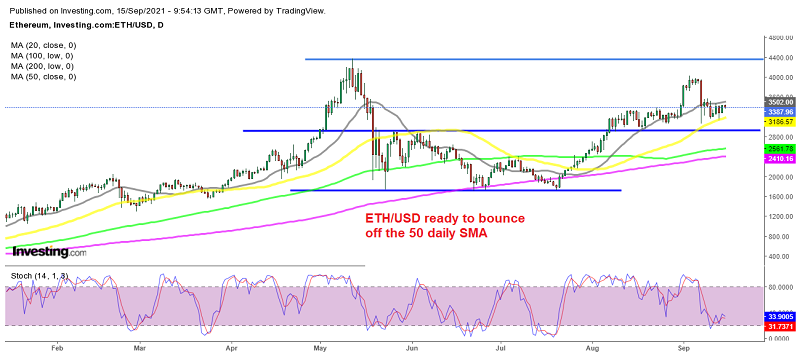
Ethereum Analysis – ETH/USD Daily Chart
Ethereum bounced off the $1,700 zone, where it formed a solid support area just above that level. The price increased to $3,300, where buyers waited for the 20 SMA (gray) to catch up with the price on the daily chart. That moving average caught up, and ETH/USD resumed the bullish trend, pushing above $4,000 for a moment.
Ethereum Live Chart
Buyers did some profit-taking when Ethereum broke above $4,000, so the price was hanging below it for some time, until the crash in the crypto market came, sending it around $1,000 lower. But, the $3,000 level held as support, and now the 50 daily SMA (yellow) has caught up. Ethereum is well oversold, as the stochastic shows, and it is getting ready to burst higher, with the ETH 2.0 update underway, which has increased the demand. But, buyers will have to push above the 20 SMA (gray) first. When that happens, we might open a buy Ethereum signal.
Ripple Coin Analysis – XRP/USD Daily Chart
The situation seems similar in RIPPLE coin as well; the 20 daily SMA (gray) was keeping the trend down during most of the summer, but it reversed off the support area above $0.50 and has been bullish since then. Ripple climbed above $1.30 initially last month, while in the first week of this month, it pushed above $1.40.

Ripple coin finding support at the 50 daily SMA
But, the Ripple coin turned out to be one of the biggest losers when the crash came, with this crypto plunging by more than 35% of its value, as it dived below $1. But, the 50 daily SMA (yellow) came to the rescue and turned into support, holding the decline after that crash.
This moving average continues to hold as support and the chart setup points to a bullish move here as well, since the stochastic indicator is oversold on this chart too. Ripple traders are used to the SEC-Ripple battle now, so whatever comes out of it in the meantime, won’t affect the price too much, until Ripple gets totally banned, which is not likely.