Inflation Jumps in Europe, But EUR/USD Reverses Down at the 200 SMA
EUR/USD has turned bearish again today at the 200 SMA, despite the higher inflation and construction output

The EUR/USD continues to show signs of weakness. This Forex pair has turned bearish since June, and it keeps making lower highs during retraces higher. However, on the last occasion, this pair reversed down from the previous resistance at $1.1910. The 20 SMA (gray) was acting as support on the H4 chart during the bullish leg, and now the MAs have turned into resistance.
The 50 SMA turned into resistance first. Now it seems like the 200 SMA (purple) is doing that job. We decided to sell this pair earlier, just below the 200 SMA, and now this moving average has rejected the price. The economic data is improving in Europe, but that’s not helping the EUR/USD.

The 200 SMA rejected the EUR/USD today
Inflation has increased to 3.0%, while the core CPI (consumer price index) inflation jumped to 1.6% in August, from 0.7% in July. The construction output also came in much better in July, at 0.1% against -1.7% in June. So, the economy is improving, but it is not helping the Euro, which has turned bearish against the GBP as well.
Latest data released by Eurostat – September 17, 2021
- August final CPI YoY +3.0% vs +3.0% prelim
- Core CPI YoY +1.6% vs +1.6% prelim
No change to the initial estimates, as headline euro area inflation is seen at a 10-year high in August, keeping the pressure on the ECB to maintain its narrative that the inflation rise is ‘transitory’.
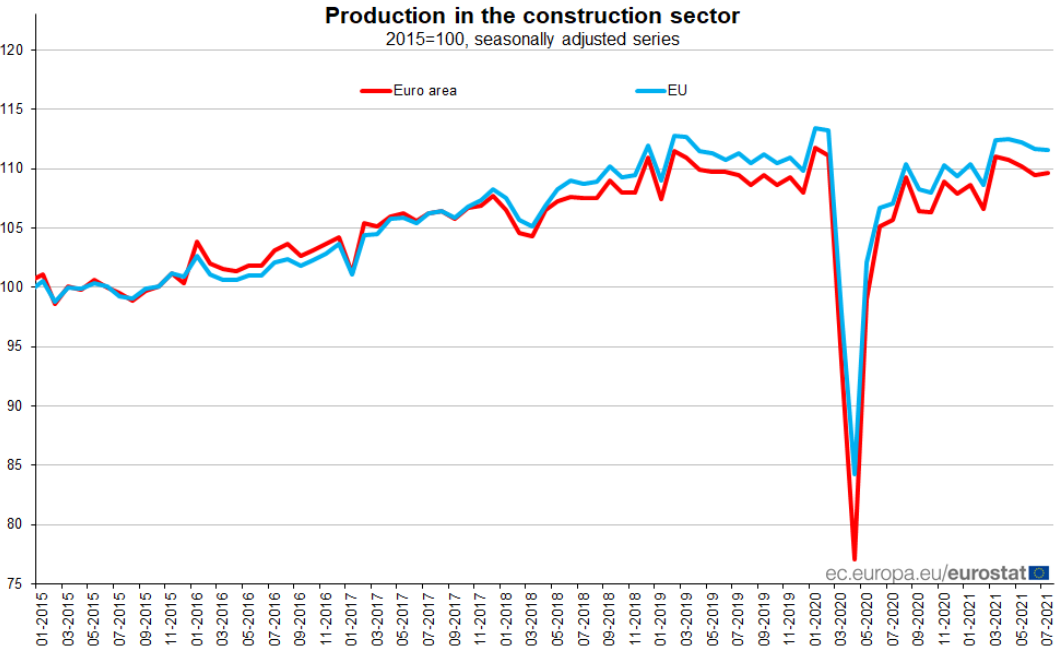
Construction Output Released by Eurostat – September 17, 2021

- July construction output MoM +0.1% vs -1.7% prior
- June construction output was -1.7%; revised to -0.6%
- Construction output YoY +3.3%
- June output YoY was +2.8%; revised to +4.1%
- Check out our free forex signals
- Follow the top economic events on FX Leaders economic calendar
- Trade better, discover more Forex Trading Strategies
- Open a FREE Trading Account


