The BTC/USD coin pair failed to stop its early-day downward rally and hit an intra-day low well below the $40,500 level. Bitcoin was unable to stay above the $42,000 support zone. As a result, there was a sharp decline in BTC, to below the $41,000 level. The price broke many support zones along the way, near $43,000 and $42,000, to enter a bearish zone.
The declines increased further below $41,000, and the price settled below the 100 hourly simple moving average. It traded close to $40,000, and formed a low near $40,200. The Bitcoin prices could continue their declines if the crypto fails to clear the $43,100 resistance zone. Immediate support on the downside is around the $42,200 level. The next major support is near the $41,500 zone. A downside break below the $41,500 zone could trigger a fresh decline towards the $40,500 level, or even as low as $40,000.
Currently, the BTC/USD currency pair is trading at 42,831.6, and consolidating in the range between 40,401.5 and 43,044.7. The declines in the BTC/USD pair could be attributed to multiple factors, be it a bearish crypto market or fake reports about Turkish President Erdogan’s remarks about Bitcoin. An article entitled “We are in a war against Bitcoin,” claims that the Turkish president, “has been having a negative impact on the BTC prices.” Exactly what did President Erdogan say? He claimed that the country “definitely” doesn’t have a problem with the spread of digital assets. He doesn’t have a problem with it, and they are, in fact promoting it, by saying that money is “part of their national identity.” Now we understand that Erdogan never said anything about a war against Bitcoin, and was always referring to cryptocurrencies in general.
In contrast, Robinhood is testing a new crypto wallet feature that will finally allow users to withdraw crypto from its app. At the moment, Robinhood users can only buy cryptos with US dollars and trade digital assets on the platform. The app does not support crypto deposits and withdrawals. However, these headlines positively impacted the BTC/USD, limiting any further losses in the currency pair.

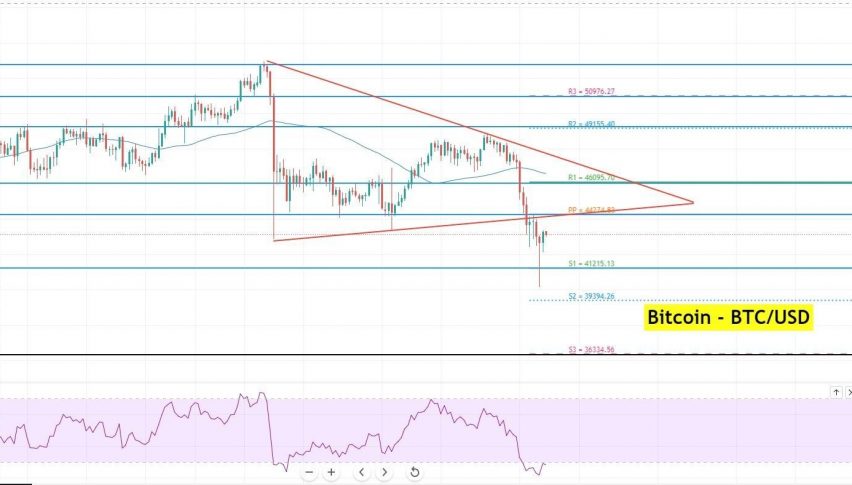
Bitcoin – (BTC/USD) – Technical Outlook
On Tuesday, the Bitcoin prices are at 43,075 dollars. The BTC/USD is trading with a positive bias at 43,230 on the hourly period, having bounced off the support level of 42,422. The next resistance level, at 44,365, is found higher up on the chart. On the hourly level, the moderate decline in Bitcoin has ended up closing a bullish reversing candle. As a result, Bitcoin is currently demonstrating a positive reversal.
On the positive side, immediate resistance for Bitcoin remains at 44,365, with a bullish breakout exposing Bitcoin to the 46,309 level. The RSI and the Stochastic have entered a positive zone, indicating a bullish bias in BTC. Bitcoin is currently trending upwards, especially above the 41,369 support level. Good luck!