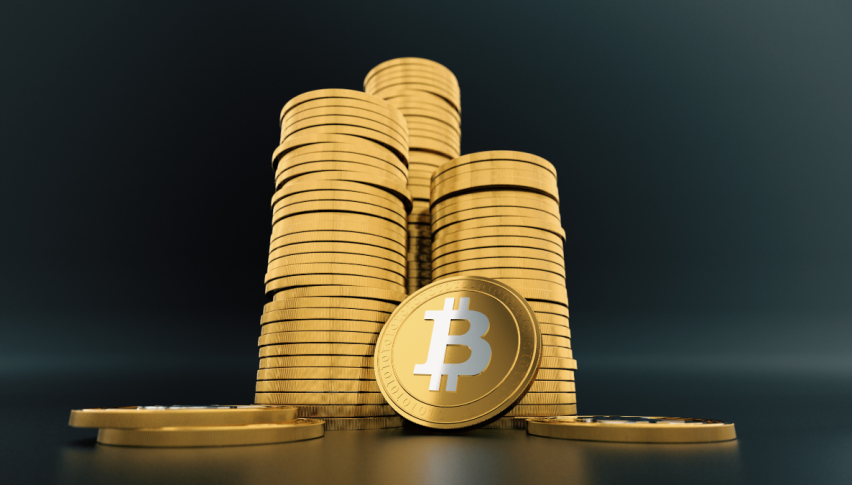
Ethereum, Bitcoin, Litecoin Price Forecast – BTC and ETH Resume the Bullish Momentum, LTC Hesitates at the 200 SMA


During September cryptocurrencies turned bearish as the crackdown from the establishment escalated further. The bearish sentiment eventually caught up with all the market, but it seems like the bearish times ended with September. In October, they have all turned positive besides a few like Litecoin. Bitcoin is leading the way up, so let’s have a look at who’s up and who’s down.
Bitcoin H4 Chart Analysis – MAs Turn Into Support

BTC/USD bounced off the 50 SMSA yesterday
Bitcoin formed a base at around $40,000 in September, after the retreat. It started to bounce off that area at the end of September, resuming a steep bullish trend. Moving averages have turned into support for BTC/USD , with the 20 SMA pushing Bitcoin higher, while the 50 SMA came to the rescue this week after the pullback lower.
The price moved above $58,000 earlier today, so it seems like we are heading for $60,000 soon and after that, the all-time high ATH just below $65,000. Now, after China closed Bitcoin mining facilities, the US has become the world’s largest Bitcoin mining country. This, as well as the recent rally, could signal the imminent approval of the first U.S. bitcoin ETF, which would help Bitcoin soar further, above $65,000.
Ethereum Daily Chart Analysis – The 50 SMA Turns Into Support

Ethereum heading for $4,000 now
Ethereum has also shown resilience since bottoming out in July, after the May/June crash. It gained around 250% in value after increasing from around $1,7000 to above $4,000 by early September. Last month, we saw a dip below $3,000 again but now buyers are back in control.
As we can see from the daily chart above, moving averages have been doing a great job as support indicators, but also as resistance. The 200 SMA (purple) did a great job in holding as support in September, while now the 50 SMA might have turned into support. ETH/USD has been finding support at this moving average in the last two weeks and now it is progressing higher as Bitcoin advances, so Ethereum seems to be headed for $4,000 soon and then the all-time highs after that.
Litecoin Daily Chart Analysis – The 200 SMA Keeeps LTC Down

The 200 SMA continues to keep Litecoin subdued on the daily chart
Litecoin has been one of the less bullish cryptos since late July. This crypto has formed a support area around $140-145 and another one just above $160. But, the 200 SMA (purple) has been acting as resistance at the top, rejecting the price for about two months now, apart from two occasions.
The price action has been very boring similar to Ripple, but at least Ripple coin has made some gains while Litecoin trades in a very tight range for more than a week. BRD, the first mobile cryptocurrency wallet to be in the App and Google Play stores, added Litecoin as it announced last week the break of the 10 million user mark. But, nothing is helping revive Litecoin as it remains asleep.