Anyone Want to Buy the Pullback in WTI Crude Oil?


The price of US WTI Crude Oil hit a high of $84.25 overnight – the highest since October 2014 – before seeing a retreat over the past few hours, with a drop of 0.8%, to the current $82.75. One could argue that a firmer dollar is perhaps providing some scope for profit-taking, but the bullish sentiment in oil is far from being put to bed.
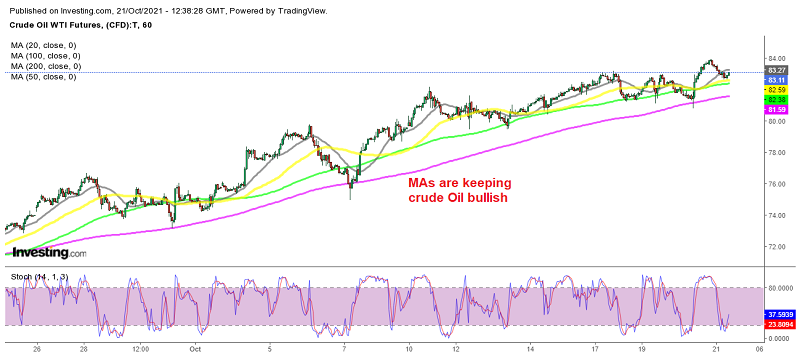
The technical side of things also continues to highlight that buyers are not throwing in the towel just yet. We’re now testing the 100-hour moving average (purple line), and above that, the near-term bias remains more bullish. But if it breaks below, there is some scope for a pullback towards the 200-hour moving average (green line) at $81.70. From a psychological perspective, however, as long as prices keep above $80, there is still good reason for buyers to stay buoyed.
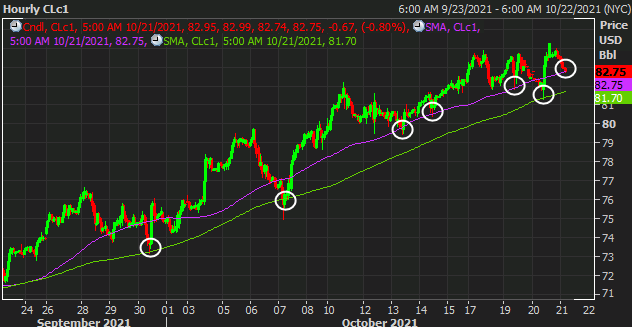
Moving averages have been great indicators to buy crude oil
As mentioned previously, the energy crisis this winter is still far from being over, and with OPEC+ not really shaking up the supply-demand dynamics for crude output, the perceived tightness in the oil market looks set to continue over the coming months. Unless there is a change to either sentiment, I’d expect dip buyers to still come out on top for oil, at least for the time being.
US Unemployment Claims Report
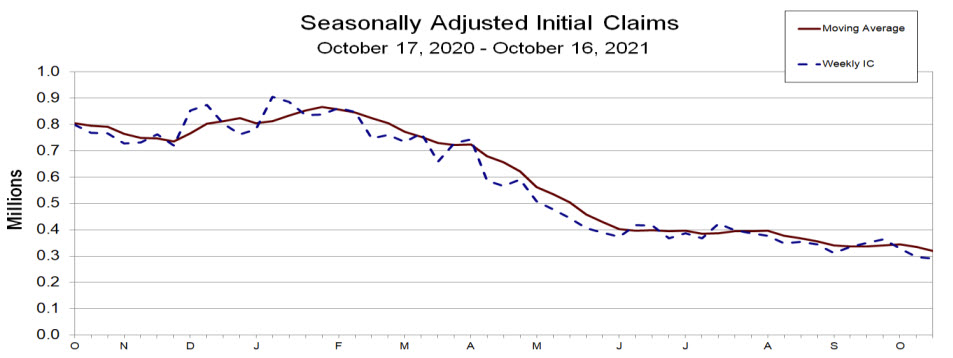
- Prior week 293K revised to 296K
- Jobless claims 290K versus 300K estimate. This is the lowest level since March 14, 2020
- Four week moving average jobless claims 319.75K versus 335K last week. This is the lowest average since March 14, 2020
- Continuing claims 2.481M versus 2.593M last week. This is the lowest level since March 14, 2021 at 1.770K
- The four week moving average continuing claims 2.655M vs 2.740M last week. This was the lowest since March 21, 2020
- The largest increases in initial claims for the week ending October 9 were in Michigan (+3,673), Missouri (+2,566), Maryland (+2,337), New Mexico (+2,012) and Kentucky (+1,454)
- The largest decreases were in Tennessee (-989), California (-851), Florida (-839), New Jersey (-464) and Alabama (-301).
The claims data does correspond with the survey week for the monthly employment numbers. The trend is lower and should have analysts looking for stronger jobs growth next month.
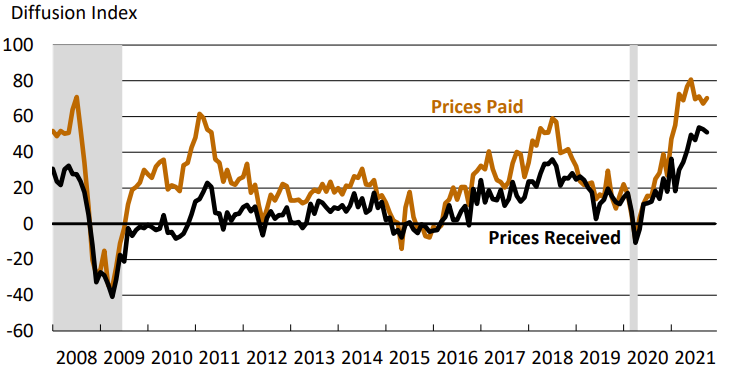
The Philly FED Manufacturing Index
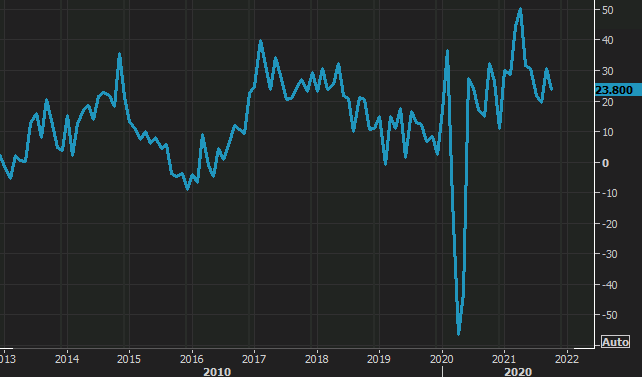
- October Philly Fed 23.8 points vs 25.0 expected
- September Philly Fed was 30.7 points
- New orders 30.8 points versus 15.9 prior
- Employment 30.7 points versus 26.3 prior
- Avg workweek 27.8 points vs 29.3 prior
- Capex 32.4 points vs 23.6 prior
- Prices paid 70.3 points versus 67.3 prior
- Future activity 24.2 points vs 20.0 prior
- Delivery times 32.2 points vs 20.4 prior
- Full report (pdf)